Your shopping cart is empty!
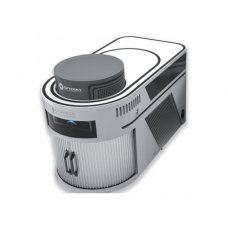
Advanced Confocal Raman Microscope


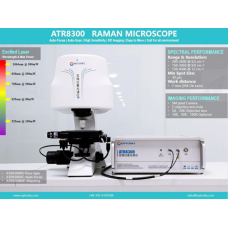
Q: What's ATR8500 Triple Band Raman Microscope Imaging & Mapping?


Availability: In Stock
Advanced Confocal Raman Microscope
Product Code: ATR8500
application
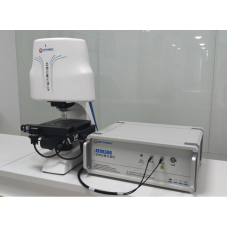
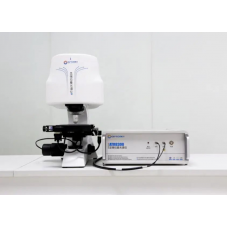
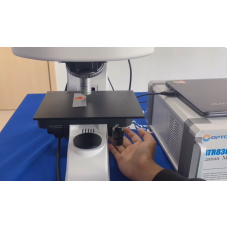
- The ATR8500 Confocal Raman Microsope combines the advantages of microscopes and Raman spectrometers. The Raman microscope detection platform is a visual and precise positioning Raman detection platform, which allows the user to detect the Raman signals of different surface states on the sample, and can be displayed simultaneously on the computer, which is greatly Facilitates Raman micro-area detection.
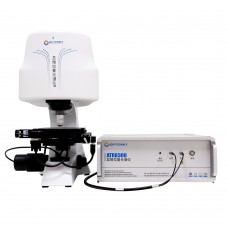
- ATR8500 raman instrument is equipped with an objective lens specially designed for the Raman system, which makes the laser spot close to the diffraction limit. The focus information is accurately and intuitively displayed on the computer through a 5-megapixel camera, which improves the quality of the Raman spectrum.
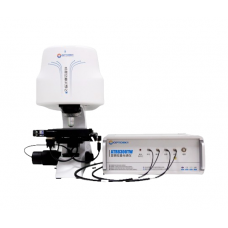
- ATR8500 adopts a unique moving part without optical path switching (patented), which perfectly solves the loss of optical path for camera imaging, realizes the separation of camera imaging and Raman signal collection, and obtains the best signal strength.
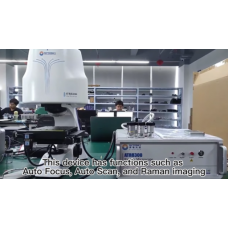
- At the same time, ATR8500 uses high-performance Raman specially optimized for micro-Raman systems. It is industry-leading in terms of sensitivity, SNR, stability, etc., providing a strong guarantee for Raman research.
| Confocal Raman Microscope | |
| SNR | >6000:1 |
| Spectral Range | 200-3700 |
| Spectral Resolution | 3-12 |
| Imaging Area | 50X50mm |
| Spot Diameter | >1μm |
| Interface | USB2.0 |
| Microscope Camera | 5-mega pixels |
| Focus Method | Conjugate Focus |
| Laser Stability | σ/μ <±0.2% |
| Laser Wavelength | One Band:532;633;785;1064;830 Dual Band:785+1064; 532+633; 532+1064; 532+785; 633+1064 Triple Band: 532+633+1064 ; 532+785+1064 High End Model: As above laser orderfrom532,633,785,830, 1064 |


-228x228.png)

-228x228.png)