
Your shopping cart is empty!

UV-Vis Spectroscopy for Decoupling Prediction of Water Contaminant Concentrations
This study uses UV-Vis spectroscopy for real-time detection of Chemical Oxygen Demand (COD) and Turbidity (TURB) in water, overcoming spectral interference with advanced techniques like SPA and SVR. It’s ideal for drinking water safety, industrial monitoring, and environmental protection.
Part.01 Research Background Chemical Oxygen Demand (COD) and Turbidity (TURB) are critical indicators for monitoring water pollution, representing the concentrations of reductive organic matter and suspended particles, respectively. UV-Vis spectroscopy, known for its rapid response, high sensitivity, and reproducibility, is widely used for indirect detection of organic and inorganic pollutants. However, turbidity-induced scattering severely interferes with COD measurements via UV absorption spectra, compromising accuracy. This study addresses spectral coupling and peak overlap during simultaneous COD/TURB detection, aiming to achieve real-time, high-precision decoupling for field water quality monitoring. Applications: Drinking Water Safety- Source Water Monitoring: Comprehensive analysis of physical parameters (temperature, pH, dissolved oxygen (DO), turbidity, conductivity) and contaminants (COD, ammonia nitrogen, total phosphorus (TP), total nitrogen (TN)) to identify pollution risks.
- Treatment Process Control: Real-time monitoring during filtration, disinfection, and distribution.
- Distribution Network Surveillance: Ensures compliance with potable water standards across pipelines.
Industrial Applications- Process Optimization: Monitor critical parameters (conductivity, hardness, specific ion concentrations) to enhance product quality in industries like chemicals, pharmaceuticals, and electronics.
- Wastewater Management: Track effluent treatment efficiency to meet national/local discharge standards.
Environmental Protection- Surface/Groundwater Assessment: Detect eutrophication, pH shifts, heavy metal contamination, and organic pollutants in rivers, lakes, and aquifers.
- Ecosystem Health: Provide scientific basis for pollution mitigation and conservation strategies.
Part.02 Detection PrinciplesWater quality analysis involves physical, chemical, and biological methods to quantify pollutants and assess safety. ( 1 ) Absorption SpectroscopyBased on the interaction between light and matter. Molecules absorb specific wavelengths, generating characteristic absorption spectra for quantitative analysis. Lambert-Beer Law: Absorbance (A) is proportional to concentration (c) and path length (l):A=ε⋅c⋅l Where:A: Absorbanceε: Molar absorptivity (L·mol⁻¹·cm⁻¹)c: Concentration (mol·L⁻¹)l: Path length (cm) The absorbance at a given wavelength is proportional to analyte concentration under constant path length. ( 2 ) Fluorescence SpectroscopyAnalyzes emitted fluorescence under specific excitation wavelengths, enabling detection of trace organic compounds. Part.03 Experimental Design Key Water Quality ParametersCOD: Reductive organic matterBOD: Microbial contentDOM:Dissolved Organic MatterTOC:Total Organic CarbonDOC:Dissolved Organic CarbonSAC:Specific Absorption CoefficientSSK:Potassium SulphateTurbidity: Suspended Particle ContentAmmonia Nitrogen, Total Phosphorus (TP), Total Nitrogen (TN) Spectral Analysis of Water Components Different water quality parameters exhibit distinct absorption spectral ranges:- Nitrates/Nitrites: 200~250 nm
- Low-MW Compounds, Aromatics, Proteins, Solvents: 250~290 nm
- Turbidity/Total Dissolved Solids (TDS): ~380 nm
Instrumentation: UV-Vis spectrometers (200–800 nm range) enable multi-component detection via full-spectrum analysis, replacing single-wavelength methods.
Traditional vs. Modern Detection | |
Traditional PMT-Based Systems | Miniature Spectrometers |
Large size | Compact design |
Slow single-wavelength scanning | Full-spectrum transient acquisition |
Limited dynamic monitoring | Real-time, continuous online monitoring |
 Measurement Principle: Ultraviolet-Visible (UV-Vis) absorption spectroscopy (spectrophotometry); fluorescence spectroscopy.Spectrometer Model: ATP2000 series (high SNR, high pixel resolution, and high integration level).
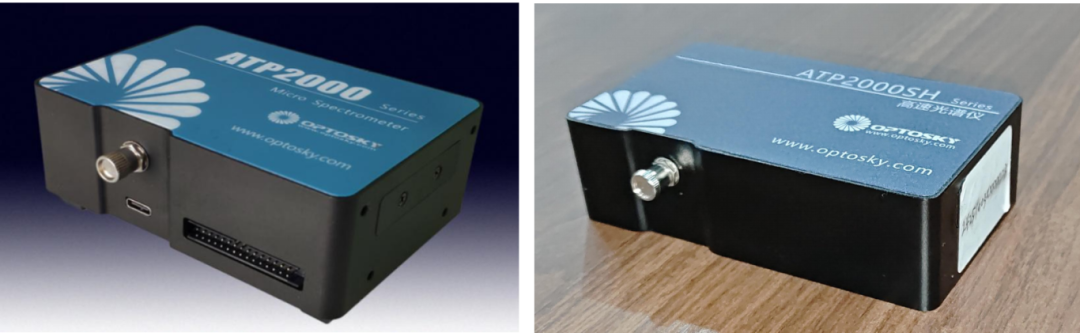
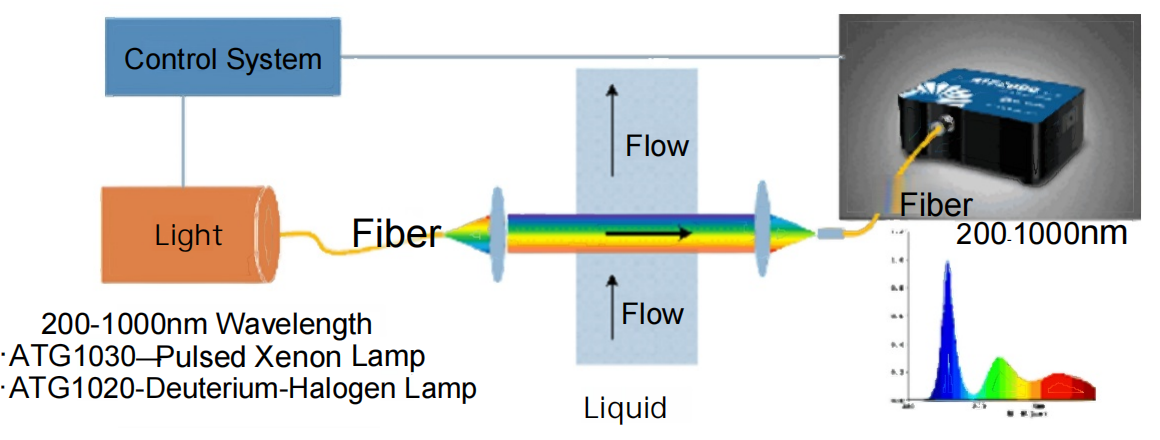
 The spectrometer measures absorbance by passing a parallel beam of light within a specific wavelength range through a cuvette containing the sample, then detecting the transmitted light. By comparing spectra before and after sample absorption, the absorption spectrum of the sample within that wavelength range is obtained.
 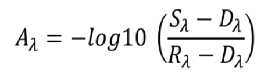 By measuring absorption across the entire UV/Vis range and establishing a chemometric model, simultaneous detection of multiple water quality parameters can be achieved. Part.04 Spectral Acquisition
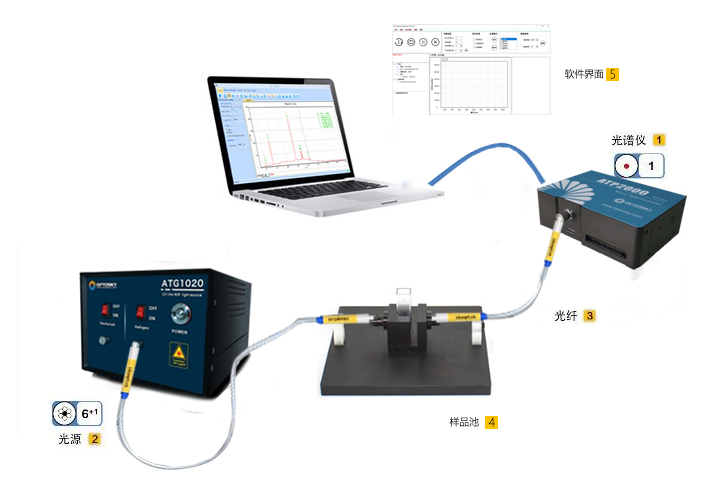
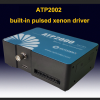
 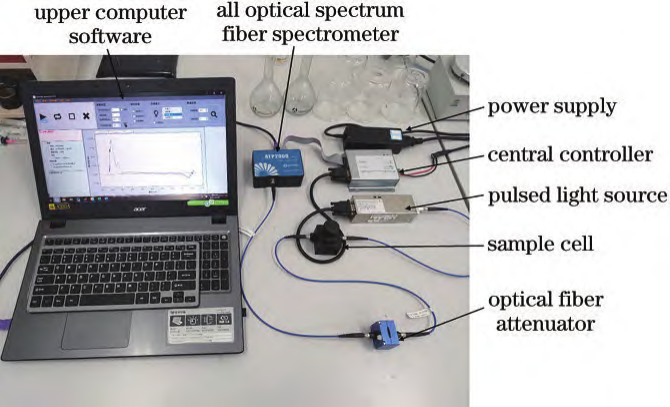 The experimental spectral acquisition system consists of an ATP2000P spectrometer, an ATG1020 pulsed xenon lamp, a central controller, cuvettes, a fiber optic attenuator, and a display. Spectrometer Specifications: Wavelength range: 180–1000 nm; resolution: 2.3 nm; SNR>500:1. A 10 mm quartz cuvette was used as the sample cell. A fiber optic attenuator adjusted the output light power of the pulsed light source to ensure stable absorption spectra, avoiding saturation distortion and noise fluctuations. Experimental Samples: COD standard solution: Provided by the National Nonferrous Metals and Electronic Materials Analysis and Testing Center, with potassium hydrogen phthalate as the solute and a mass concentration of 500 mg/L.Formazin turbidity standard solution: Provided by Hangzhou Qiwei Instruments Co., Ltd., 400 NTU. Spectral Data Acquisition:Absorption spectra of COD and turbidity standard solutions with varying concentration gradients were collected.Effective spectral range: 180–400 nm; integration time: 9 ms; sampling interval: 500 ms; average scan repetitions: 20. Each sample underwent five spectral acquisitions, with results averaged. Spectral plots are shown below:
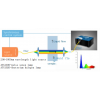
 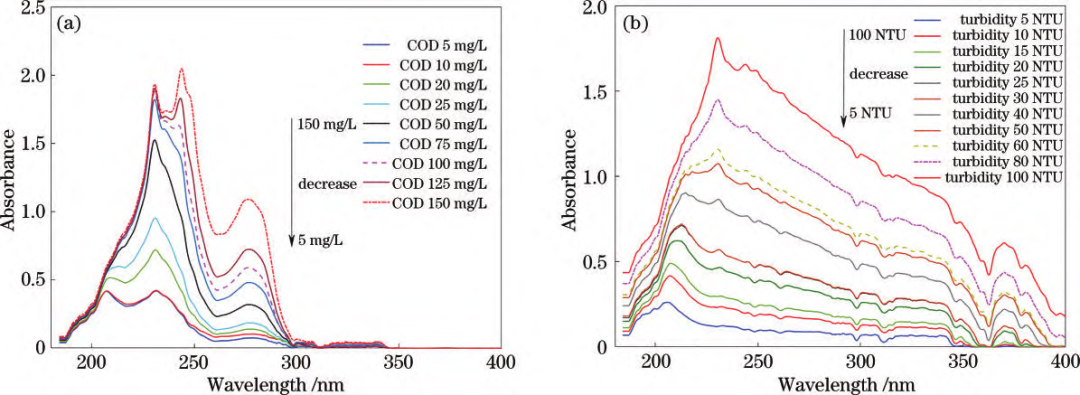 Standard solution UV absorption spectra: (a) COD; (b) Turbidity.
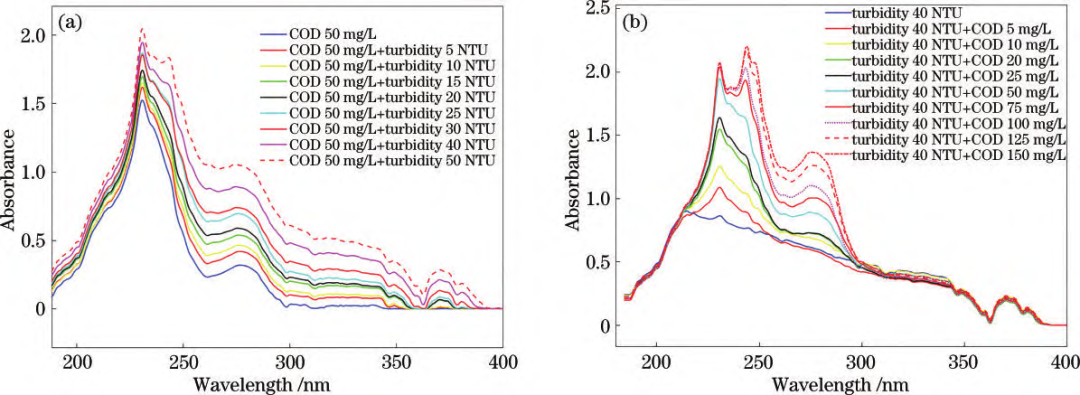 Mixed solution UV absorption spectra: (a) COD + turbidity interference; (b) Turbidity + COD interference. By comparing the spectral profiles of the standard solution samples, it can be observed that the primary absorption characteristics of COD and turbidity are concentrated within the 180–400 nm range. 1. COD: Characteristic peaks appear between 180–300 nm. UV absorbance increases with higher COD concentrations, with two distinct absorption peaks rising significantly.2. Turbidity: Absorption features span 180–400 nm, with overall absorbance increasing with higher turbidity.3. Mixed samples: Turbidity interference elevates COD absorption peaks and shifts the main peak rightward. COD interference amplifies turbidity absorption peaks, while the 300–400 nm range remains less affected. Spectral Data Preprocessing:External factors (environmental conditions, measurement settings, and instrument characteristics) significantly impact spectral measurements. Raw data often contains redundant and collinear information, degrading model accuracy and processing efficiency. To mitigate this, preprocessing steps such as feature wavelength selection and algorithm optimization (e.g., SPA and SVR) are applied to extract meaningful spectral data and enhance model precision.
 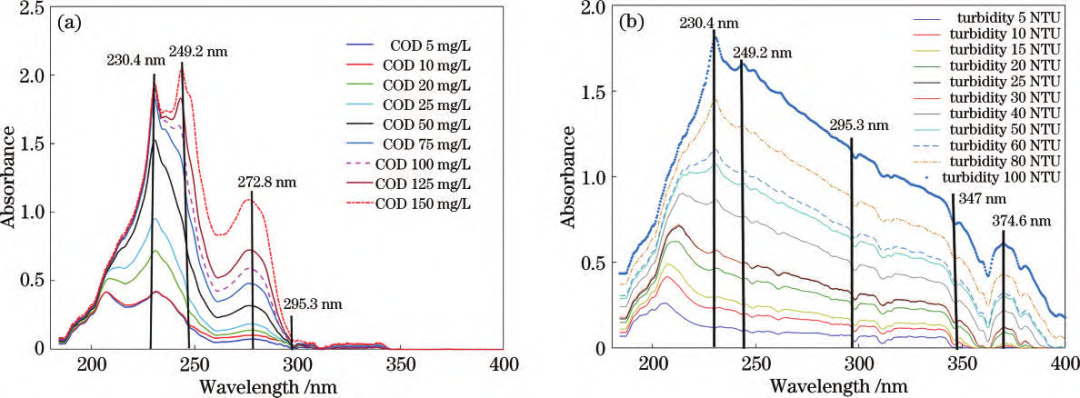 Feature wavelength plots: (a) COD; (b) Turbidity. Using the Successive Projections Algorithm (SPA) for feature wavelength extraction, redundant variables were eliminated, minimizing interference. Support Vector Regression (SVR) parameter optimization enabled an enhanced model that effectively reduces coupling effects and spectral overlap between COD and turbidity. This achieves precise simultaneous prediction of COD and turbidity in water samples, even for low-range turbidity solutions, realizing synchronized UV spectroscopic detection of both parameters.
References:1. Jiang J., et al. "SPA-SVR-Based UV Spectral Decoupling for Water Contaminants," Laser & Optoelectronics Progress, 2023. DOI: 10.3788/LOP220700.2. Zhou S., et al. "EWMA-PCA Standardization for Water Spectral Data," Spectroscopy and Spectral Analysis, 2020. DOI: 10.3964/j.issn.1000-0593(2020)11-3443-08.

Search
Categories
Popular Posts


Latest Posts


Comments: 0
No comments