Research On Key Technology Of Near-Infrared Cerebral Hematoma Detection Using ATP2000 Spectrometer
Traumatic brain injuries are commonly seen and have high mortality. Cerebral hematoma is acknowledged as the most hazardous secondary lesion, requiring timely diagnosis and treatment. During the war, natural disasters, and traffic accidents, the seasonable arrival of medical equipment remains a tricky problem, thus leading to the rescue equipment deficiency.
Brain trauma is common and frequent, with high mortality. During wars, natural disasters, and traffic accidents, medical equipment such as CT and MRI are difficult to reach. The emergency scene lacks equipment that can be used for cerebral hematoma detection. The portable cerebral hematoma detection technology and equipment based on near-infrared is considered to be the most suitable method for the detection of cerebral hematoma at the emergency scene, but the improvement and innovation of this instrument require the technical support of ATP2000. Dr. Sun Qiuming’s research paper on near-infrared cerebral thrombosis detection has repeatedly mentioned the use of Optosky's ATP2000 to help him conduct research on related bachelor issues.
In the basic performance test of the detector prototype, the test under ambient light interference is to investigate the suppression effect of the detector prototype on the ambient light interference in typical applications and compare it with foreign products. The method is to use white light LEDs and incandescent lamps to simulate indoor light sources, measure the ambient light intensity at the detection position with an illuminance meter, and turn off the ambient light source when the detector measures the left position. When the detector performs the right position measurement, the ambient light source is turned on; the optical density difference between the left and right sides measured by the detector measures the equipment's ability to suppress ambient light. The equipment is the incandescent lamp (200W), white LED table lamp (8W), and POM white optical analog. Ambient light intensity detection instrument: Proskit MT-4617LED illuminance meter. Then use Optosky's ATP2000 spectrometer to test the wavelengths of incandescent lamps and white LED desk lamps. The curve is shown in Figure 1. The wavelength range of incandescent lamps is roughly between 450 and 900 nm, and the wavelength range of white light LEDs is between 440 and 660 nm. Finally, get a clear result analysis.

In the process of developing a handheld near-infrared intracranial hematoma detector, Dr. Sun again used Optosky’s ATP2000 spectrometer to test the wavelength of LD. The curve is shown in Figure 2. The center wavelength is 805nm and the spectral width is approximately 4nm.

ATP2000 spectrometer which is manufactured by Optosky helps Dr.Sun a lot.
(1)Established A 5-layer optical simulation model of the brain that can simulate different degrees of hematoma, and the influence of hematoma on the photon transmission path is studied.
(2)Established PLS prediction method for scalp absorption coefficient.
(3)Designed a bilateral hematoma detection algorithm using pattern recognition technology
(4)Study the fast digital phase lock algorithm under square wave modulation.
(5)Designed a new sliding hood and elastic probe structure.
There are so many kinds of the spectrometer, why we choose the Optosky’s spectrometer?
Description:
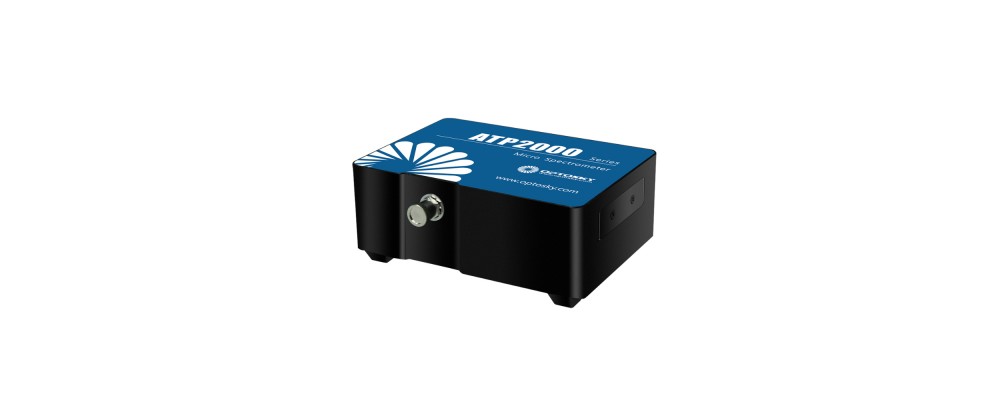
- ATP2000 is an ultra-high-speed, low-cost, cost-effective, multi-purpose spectrometer with multiple breakthrough technologies launched by Optosky.
- ATP2000 uses a 2048 pixel linear CCD, which can be adapted to the test in the 200-1100nm wavelength range. The exposure time of the CCD detector can be controlled within 1ms, and customers can precisely control the signal-to-noise ratio of the spectrometer.
- ATP2000 is an ideal choice for ultraviolet, visible, and near-infrared spectroscopy applications. There are different slits, gratings, mirrors, and filters to choose from. You can configure spectrometers suitable for different applications according to your needs. The spectral range starts from 200nm to 1050nm, the spectral resolution can be selected from 0.5 to 4.0nm. Optosky’s spectrometer can also provide customized options for OEM customers.
- ATP2000 can receive the light to be measured from the SMA905 interface optical fiber input or free space input, measure according to the set integration time, and output the measurement result through USB2.0 (high speed) or UART;
There is its specific feature:
- Spectral Range:200-1100 nm;
- Lightpath structure:Cross C-T optical path;
- Detector:2048 pixel CCD;
- Integration time:1ms-130s
- Power supply:DC 5V (power can be taken directly from USB);
- ADC bit depth:16 bit ;
- ADC sampling rate:2MHz;
- Optical input interface:SM905 optical interface or free space input;
- Data output interface:USB2.0 (high speed) or UART; 20-pin expansion interface;
It is widely used :
- LED sorting machine;
- Multi-parameter online water quality analyzer;
- Micro and fast spectrophotometer;
- Fluorescence Spectrometer;
- Biomedical analyzer;
- Transmission rate detection;
- Reflectance detection;
- LIBS;


-75x75.jpg)


Comments: 0
No comments