UAV Hyperspectral Imaging Identifying Urban Black and Odorous Water Bodies
This study explores the use of UAV hyperspectral imaging and fluorescence spectroscopy to identify and monitor urban black and odorous water bodies for better pollution control and water quality management.
Introduction
Urban black and odorous water bodies are defined as water systems within urban built-up areas that exhibit unpleasant colors and/or unpleasant odors. These water bodies can be categorized into "mildly black and odorous" and "severely black and odorous" categories. The rapid urban development and excessive wastewater discharge have led to the influx of organic materials into rivers, exceeding the rivers' self-purification capacity, resulting in oxygen imbalances and the formation of hypoxic environments, which contribute to the degradation of water quality and the eventual formation of black and odorous water bodies. This phenomenon has become a major obstacle to urban development and water ecological civilization construction.
The advent of satellite remote sensing technology has facilitated preliminary applications in screening urban black and odorous water bodies, playing a critical role in the detection and supervision of pollution remediation projects. However, satellite imagery often suffers from long acquisition cycles, limited spectral channels, and cloud interference. In contrast, UAV remote sensing offers advantages such as ease of operation, high temporal, spatial, and spectral resolution, making it ideal for providing rich spectral data to support model development for water monitoring. Additionally, fluorescence spectroscopy technology is capable of identifying organic pollutants in water, offering further insights into pollution sources.
Materials and Methods
Study Area Overview
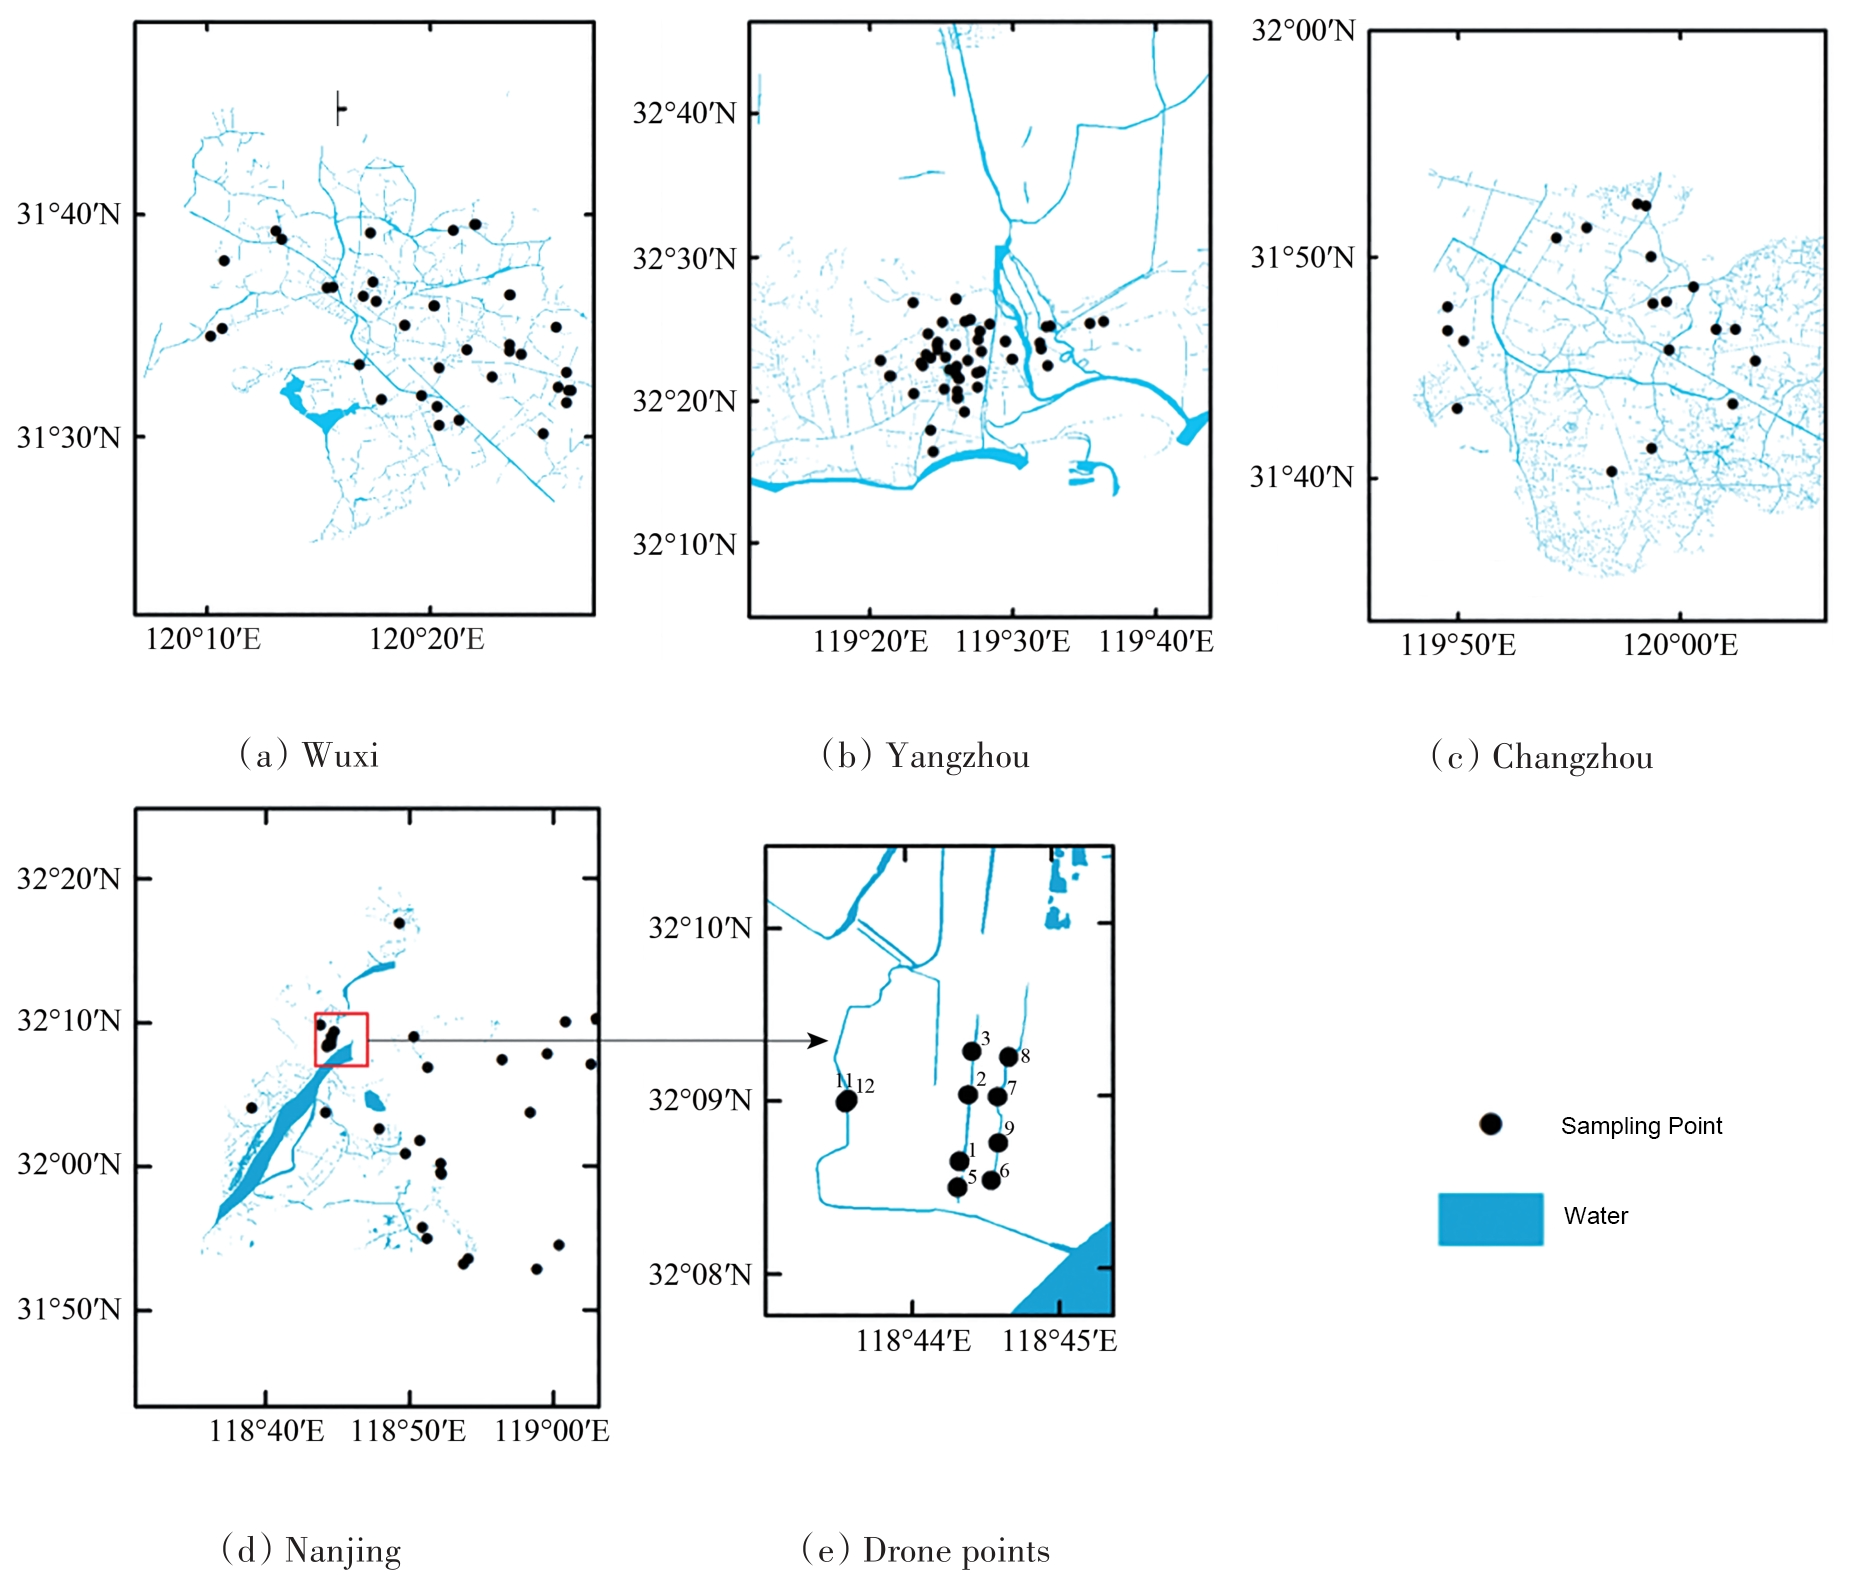
Jiangsu Province, a major industrial hub in China, includes cities such as Nanjing, Wuxi, Changzhou, and Yangzhou, which have seen rapid industrialization and high population densities. Before 2016, many rivers within these cities experienced black and odorous water phenomena due to high pollution levels. Despite efforts to treat these waters, some rivers have seen recurring pollution problems. Therefore, identifying pollution sources and assisting in decision-making for pollution control has become a crucial task.
Indicators and Data
Black and Odorous Water Body Determination Criteria
The identification of black and odorous water bodies relies on both field observations and water quality indicators outlined by the Ministry of Housing and Urban-Rural Development. These indicators include transparency, dissolved oxygen, oxidation-reduction potential, and ammonia nitrogen levels.
Parameter | Mild Black Odor | Severe Black Odor | Measurement Method | Remarks |
Transparency (cm) | 10–25 | <10 | Secchi Disk | In-situ Measurement |
Dissolved Oxygen (mg/L) | 0.2–2.0 | <0.2 | Electrochemical Method | In-situ Measurement |
Oxidation-Reduction Potential (mV) | -200–50 | <-200 | Electrode Method | In-situ Measurement |
Ammonia Nitrogen (mg/L) | 8.0–15 | >15 | Nessler's Reagent | Post-Filtration Measurement |
Ground Data Collection
Data was collected from 144 sampling points across urban areas. The sampling included locations near residential areas or factories, which are typically more prone to pollution. The parameters measured in the field include dissolved oxygen (DO), oxidation-reduction potential (ORP), and remote sensing reflectance, while laboratory tests assessed parameters like dissolved organic carbon (DOC), sulfides, and ammonia nitrogen.
UAV Hyperspectral Data
The study Use hyperspectral camera to capture images over a river section in Nanjing. The hyperspectral camera covered a range of 400-1000 nm with a spectral resolution of 2.8 nm, and the data was preprocessed for spectral calibration, reflectance calculation, and geometric correction.
Experimental Methodology
Fluorescence Index Calculation
Fluorescence parameters, including Biological Source Index (BIX), Humification Index (HIX), Fluorescence Index (FI), and Fluorescence Peak Ratio (IA:IT), were calculated to analyze the fluorescence characteristics of dissolved organic matter (DOM) in the water. These indices are used to understand the origins of DOM and to assess the complexity of organic matter in polluted waters.
Conclusion
This study investigates the potential of using UAV hyperspectral imaging and fluorescence spectroscopy to identify pollution sources in urban black and odorous water bodies. By analyzing the optical and fluorescence characteristics of dissolved organic matter, this research contributes to the development of new methodologies for pollution source identification and the improvement of water quality monitoring techniques. The integration of these technologies provides valuable insights for urban water management and pollution control efforts.
Search
Categories
Popular Posts
Latest Posts


-100x100.jpg)


-75x75.jpg)


Comments: 0
No comments