Your shopping cart is empty!
Applications of Hyperspectral Imaging in Cultural Heritage Research
This article explores the use of hyperspectral imaging in analyzing a jade bi artifact from the Hongshan Culture. By combining principal component analysis and spectral angle mapping, it identifies material compositions and their distributions, offering valuable insights for cultural heritage research.
Research Background
Hyperspectral imaging (HSI) provides both 2D spatial and 1D spectral data, capturing high-resolution reflectance spectra and image information. As one of the safest non-destructive testing (NDT) technologies, it is highly suitable for cultural heritage research and preservation.
Non-Destructive Detection
HSI enables artifact detection without direct contact. Using visible and near-infrared (NIR) spectra instead of Raman or infrared spectroscopy, it ensures a completely non-destructive approach, making it ideal for delicate cultural relics.
Penetration Capability
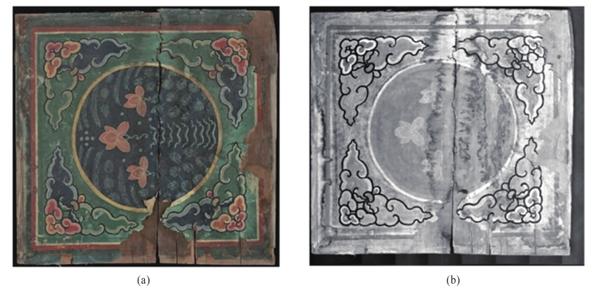
NIR wavelengths can penetrate most mineral pigments, revealing underlying ink traces beneath paint layers. This makes it highly effective for extracting hidden details in painted artifacts.
Integrated Spectral and Spatial Data
HSI combines spectral and image data, enabling material composition identification and relative concentration mapping. This feature facilitates the rapid study of large-scale artifacts, providing critical insights for conservation efforts.
Technical Approach and Key Content
Data Collection
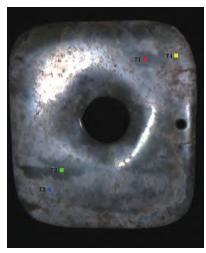
The study focuses on a jade bi artifact excavated from the Hongshan Culture site at Niuheliang, exhibited in the Ancient Liaoning Hall of the Liaoning Provincial Museum. The jade bi features a yellow-green hue with whitish patches, a rounded square shape, a circular central hole, and a smaller drilled hole for suspension.
To eliminate environmental light interference during hyperspectral imaging (HSI) data collection, all components except the portable computer were enclosed within an aluminum alloy frame covered with black fabric.
Advantages: Non-destructive detection, preservation of sample integrity, and comprehensive spectral data collection for the entire artifact.
Data Preprocessing
After reflectance calibration using a 99% white calibration plate, noise reduction was performed. The hyperspectral image was transformed vertically or horizontally to align with the original image for spectral analysis.
Advantages: Enhanced data quality, reduced noise interference, and improved reliability of spectral signal analysis.
Spectral Preprocessing
Due to the large size and high correlation of hyperspectral data, Principal Component Analysis (PCA) was employed to reduce redundancy and dimensionality while isolating noise. This compression highlighted key spectral information and produced more vibrant color images.
Advantages: Increased computational efficiency, better visualization, and reduced data complexity.
Feature Spectrum Extraction
Based on the prominent texture of the PC-3 image, four Regions of Interest (ROIs) were selected, each consisting of 100–150 pixels. These regions were representative of the jade bi's surface. The spectral curves of these regions were calculated and compared to analyze the artifact's composition.
Advantages: Precise selection of regions for localized analysis and accurate classification of spectral features.
Classification Model
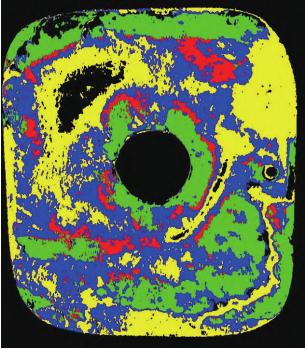
Using the four spectral curves from the ROIs, spectral angle mapping (SAM) was applied to the entire jade bi, generating a detailed distribution map of material compositions. Micro-area detection further refined the compositional analysis, enhancing accuracy and representativeness.
Advantages: Detailed classification of materials, visualization of component distribution, and targeted analysis for cultural artifact research.
Conclusion
This study collected hyperspectral data of a jade bi artifact excavated from the Hongshan Culture Niuheliang site using a hyperspectral imaging system. To analyze the composition and spatial distribution of the materials in the jade bi, Principal Component Analysis (PCA) was applied to extract surface texture features. Based on these features, Regions of Interest (ROIs) were selected, and corresponding spectral curves were extracted. By comparing these spectral curves, four primary components of the jade bi were identified. Finally, spectral angle mapping (SAM) was employed to generate a comprehensive material distribution map of the entire jade bi.
The results indicate that this method can clearly display the distribution of various components across the jade bi. This approach can provide clear guidance for identifying compositional regions in other modern micro-area detection methods.
Search
Categories
Popular Posts
Latest Posts







-100x100.jpg)


-75x75.jpg)


Comments: 0
No comments