imoptosky@gmail.com
Navigation
media

Detecting Wheat Leaf Chlorophyll Content with Non-destructive Spectroscopy

As a large agricultural country, crop growth is constantly studied and monitored by many scholars. Therefore, Wang Xue et al. of Agricultural University of China used high-resolution micro-spectrometers to collect the reflection and transmission spectra of wheat leaves, and discussed the feasibility of using micro spectrometers to detect the chlorophyll content of plant leaves.

Chlorophyll content is an important factor affecting plant growth. At the same time, the growth status of crops is also observed. Therefore, timely and accurate detection of chlorophyll content of crops can monitor the growth of plants in China and evaluate the status of water and fertilizer. Wang Xue and others from China Agricultural University used high-resolution spectrometers to collect emission and transmission spectra, and applied partial least squares (PLS) to establish quantitative analysis models of chlorophyll content, reflection and transmission spectra of wheat leaves, and discussed the use of optical fibers. The feasibility of spectrometer to detect the chlorophyll content of plant leaves.
The sample came from the Shangzhuang Experimental Station of China Agricultural University, collecting 61 wheat leaves of the same growth period, different varieties, and different fertilization levels. The sample set is randomly divided into a calibration set and a test set, 48 of which are used as the correction set and 12 samples are used as the prediction set.
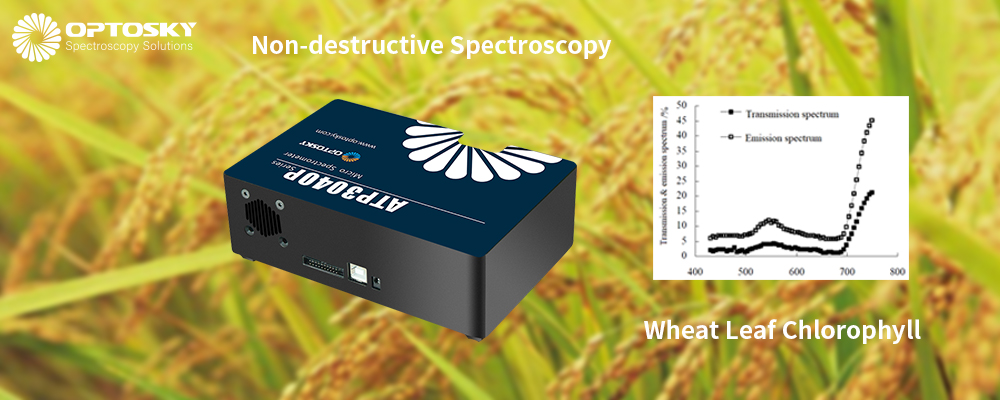
The wavelength range of the collected spectrometer is 200~1100 nm, and the sampling interval is 0.27 nm. Each sample is scanned 3 times and the average is taken as the spectrum of the sample. Remove the bands with greater influence of noise. According to the absorption of light by chlorophyll in the visible light region, the spectrum is studied in the 430~750 nm band. Figure 1 shows the reflection and transmission spectra of wheat leaves.
As the key of this experiment, a spectrometer with a variety of algorithms software is very important. Optosky recommend ATP3040 un-cooled low-noise spectrometer cover 200-1100nm, small size and inculde free software with a variety of pre-processing algorithms.


Comments: 0

No comments

Leave a Reply

Your email address cannot be published. Required fields are marked*

Related Products
Popular Tags
fast identify liquid reagent on quanitification method How to Controll Drugs and Narcotics by Safity Non-destructive Identification? ATR8000 automatic high-throughput Raman spectrometer ATR8000-first-appeared all-automatic & high throughput portable Raman analyzer OPTOSKY AT SPIE BIOS Expo 2020 fast test fake by raman OPTOSKY is coming to SPIE ATR8000 detect demonstration Thanksgiving! Raman identify starch medicinal accessories ATR3200 Double-Wavelength Raman Spectrometer ATH3010 Rotary-broom hyperspectral camera What is the advantage of 1064nm Raman of Optosky? What is the new choise for Raman characterization f carbon materials? new method for rapid detection of counterfeit drugs handheld raman spectrometer raman spectrometer raman spectrometer diagram optosky Why optosky measures absorbance by modular spectrometer? Handheld Raman spectrometer of optosky optical analysis instrument RMID raman spectrscopy portable Raman analyzer Merry Christmas from optosky How is the Raman spectrometer of optosky used in optical ? New dual wavelength Raman spectrometer for detect small sample in lab. ATR6500 penetrating and long-distance video How many advantagesof Raman ID applied to pharmaceutical industry? 2020 SPIE BIOS And West Photonic Show with Optosky 【Video】Portable Hyperspectral Camera measure ATH60 series Lab Hyperspectral Imaging Cabinet detect Airborne Hyperspectral Imaging Diamond Raman OPTOSKY Is Ready For 2020 live Live What is the advantage of 1064nm Raman spectrometer? NanoBio serise uv-vis Spectrometer UV-Vis Spectrophotometer How to use 1064nm Handheld Raman Spectrometer rapid test narcotics ? Raman spectroscopy Fieldspec Portable NIR Grain Analyzer Handheld RamanSpectrometer fast measure accurate test Measuring Fentanyl full-range spectroradiometers Soil salinization Portable Raman Spectroscopy ,Food Analysis Field Operation Food Safety The Fieldspec Accessory --Contact Probe Hyperspectral remote sensing 5th generation ultra-light ultra-thin small size Pocket Raman Spectrometer Mini Instrument fieldspec Crop yield estimation Hyperspectral remote sensing technology Hand-held Raman Raman Spectrometer Portable or Benchtop Raman Sorting Technology Raman Raman spectrometer Hyperspectral imager Hyperspectral and LiDAR data identify -diamonds-raman- spectrometer Borax ID by Raman Imaging Microscope Ancient Painting Restoration by Confocal Raman Microscope soybean varieties classification Red tides detailed spatial distribution rice leaf blast (RLB) infection raman imaging microscope Ultraviolet (UV) hyperspectral the manufacturing product chain Scientific -Grade Quodriband Raman Microscope Raman Spectrometer for Food Additive Detection Raman Spectrometer For Distinguishing Chinese herbal medicine raman microspectrometer cataracts Experimental Teaching System of Raman Spectrometer chemical research Textile testing Raman technology Raman spectrometers Raman Spectrum HBCO Blood Detection Forensic Science HGB Hyperspectral imaging Materials Science thin film structural materials superlattice materials semiconductor material high temperature resistant materials carbon nano materials Hyperspectral Imagery for Oil Spill Detection the spectralum of microplastics Fluorescence imager Total organic carbon Time-of-flight mass analyzer X ray fluorescence FT-IR spectrometer Hyperspectral imager for agricultural production