
Your shopping cart is empty!
IR2100 Measuring The Sweetness Of Bayberry With Online NIR Spectrometer
This article introduces IR2100 Measuring The Sweetness Of Bayberry With Online NIR Spectrometer.
Principles of Near Infrared Spectroscopy
Near-infrared spectroscopy (NIRS) technology is an analytical method based on the frequency-doubled and main frequency absorption spectra of molecular vibration spectra. When near-infrared light irradiates the sample, the molecules in the sample absorb the photon energy that matches their vibration frequency, thereby achieving a transition from the ground state to the excited state.Different substances have different molecular structures and compositions, and their absorption characteristics of near-infrared light will also be different. Therefore, by measuring the absorption spectrum of a sample to near-infrared light, information about the internal structure and composition of the sample can be obtained.
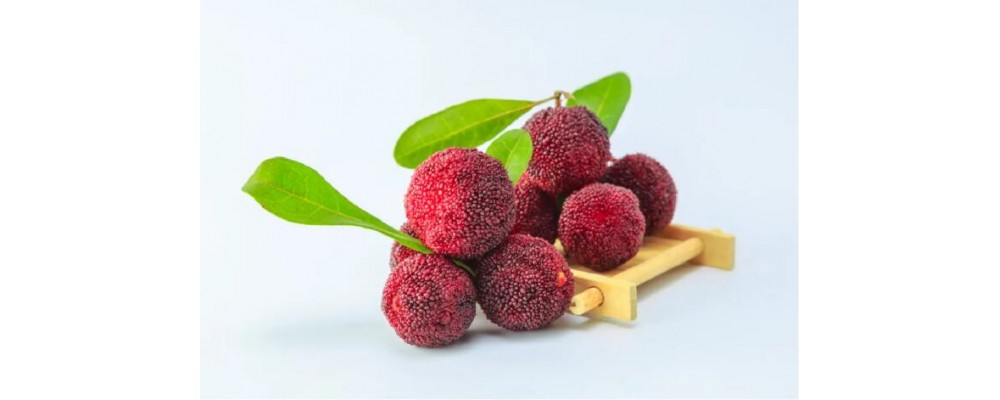
Bayberry Sweetness Test
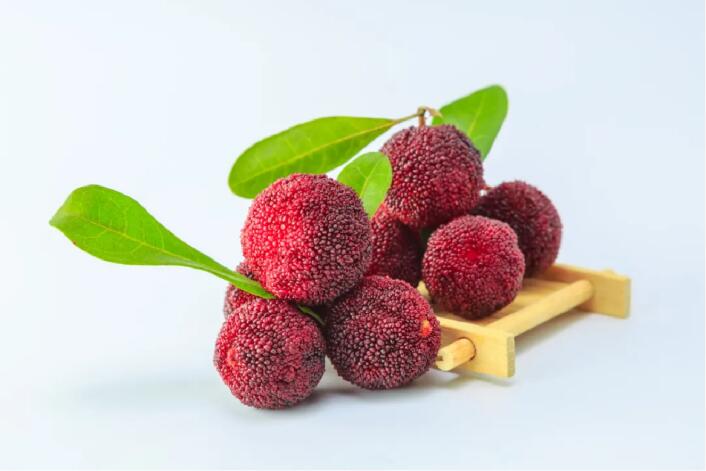
Bayberry is a common fruit, and its sweetness is one of the important factors that consumers consider when purchasing. Traditional methods of measuring the sweetness of bayberry often require destroying the fruit, such as using a sugar meter to measure after squeezing the juice, which is not only cumbersome to operate, but also wastes the fruit. Therefore, non-destructive testing technology has become a new solution.As a non-destructive testing technology, near-infrared spectroscopy has shown great potential in measuring the sweetness of bayberry. By emitting near-infrared light of a certain wavelength to bayberry fruit and collecting and analyzing the data of the returned light, information about the sugar content inside the fruit can be obtained. Specifically, when near-infrared light is irradiated to bayberry fruit, the sugar molecules in the fruit absorb the photon energy that matches its vibration frequency, thereby achieving a transition from the ground state to the excited state.By measuring the absorption spectrum of near-infrared light of bayberry fruit, a correlation model between sugar content and spectral data can be established. Then, by using this model to process and analyze the spectral data of unknown bayberry fruit, the sweetness of the fruit can be predicted quickly and accurately.
Product Recommendation
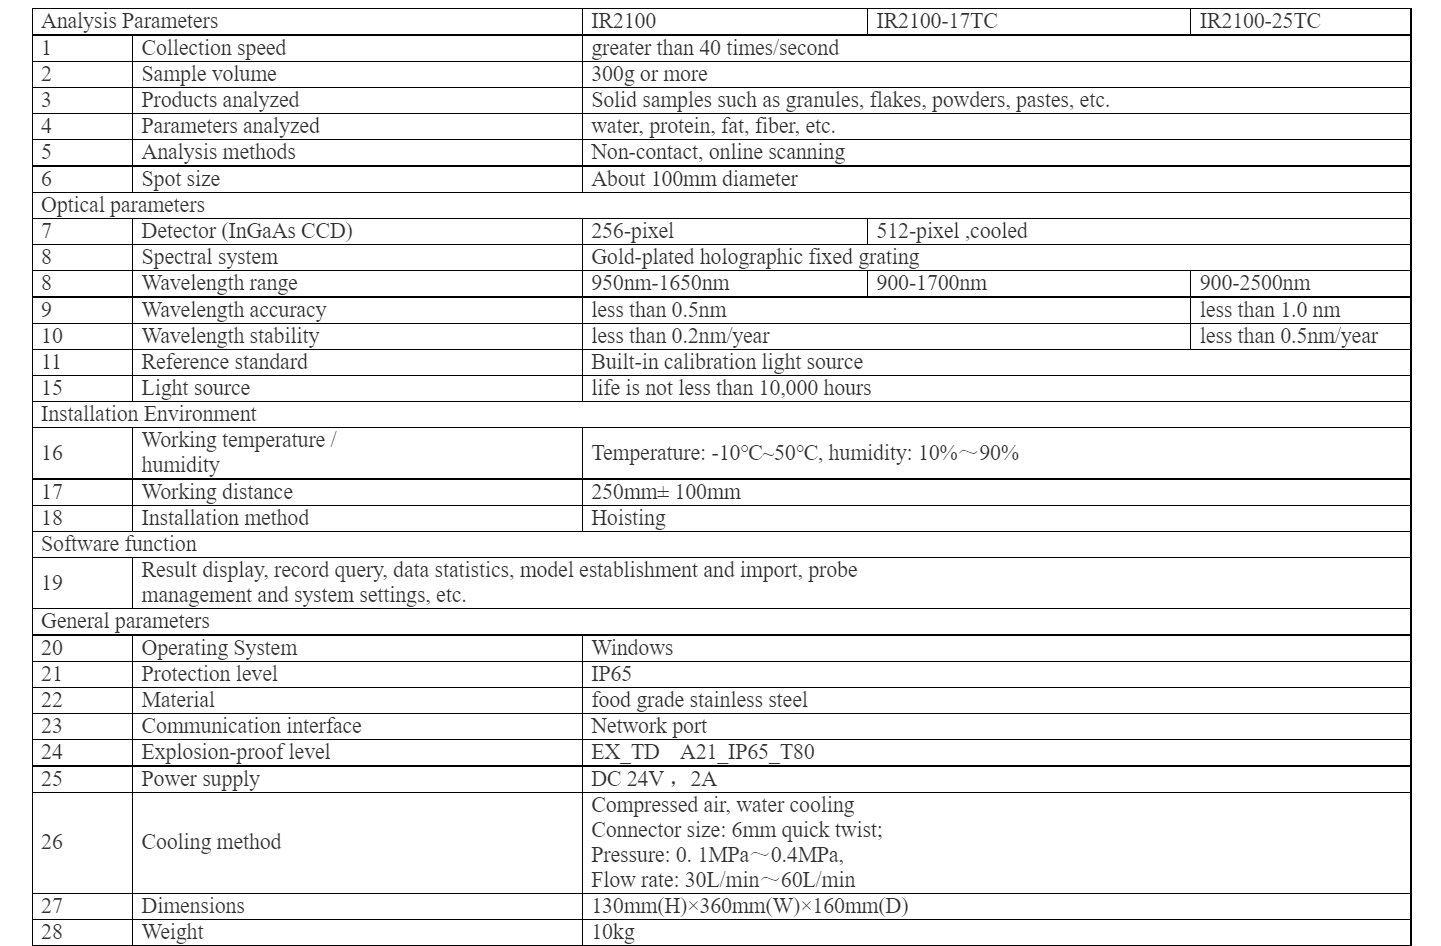
IR2100 Online Full Spectrum Near Infrared Instrument
Features
- Stable optical system:The spectrometer developed independently for online near-infrared applications uses a gold-plated holographic fixed concave grating + electrically constant temperature cooling InGaAs diode 256 array detector, which has high sensitivity, no moving parts, and high stability.
- Advanced calibration system:Built-in high-precision linear stepper motor controls the reference standard diffuse reflector, which has good shock resistance and can ensure the long-term stability of the instrument's optical system
- Non-contact large spot irradiation:The non-contact detection method ensures that the instrument is not affected by the sample state, greatly prolongs the instrument life, and is easy to maintain; the effective spot diameter is about 100mm, which is very suitable for online detection of uneven samples
- Fast measurement speed:High-speed spectral data acquisition speed of more than 40 times/second can form big data analysis and statistical trend charts
- Rich software functions:Support online calibration modeling, model import and export, and configuration of multiple probes
- High cost performance:The instrument adopts a fully enclosed design, which can effectively eliminate the influence of stray light and the on-site environment, and uses positive pressure clean air to protect the lens. The light source has a long service life (more than 10,000 hours)
IR2100 Application of measuring sugar content of bayberry
Brix
Jan.1st
Jan.2nd
Jan.3rd
Jan.4th
Jan.5th
Average
Absolute error
10.6
10.1
10.1
10.3
10.2
10.3
10.2
0.4
11.2
11.5
11.4
11.5
11.6
11.6
11.5
0.3
12.5
12.8
12.9
13.0
12.8
12.9
12.9
0.4
13.4
13.6
13.8
13.8
13.7
13.8
13.7
0.3
The test results of bayberry show that the measurement error is within 0.5, which shows that the sweetness of bayberry can be accurately measured by IR2100.
By measuring the absorption spectrum of bayberry fruit to near-infrared light, a correlation model between sugar content and spectral data can be established to model the sweetness of bayberry.
IR2100 uses the principle of full-spectrum near-infrared. When measuring fruits, the sugar molecules in the fruits absorb the photon energy that matches their vibration frequency, thereby achieving a transition from the ground state to the excited state. It has a wide range of application scenarios in fruit sweetness measurement and agriculture.
Product Recommendation
IR2100 Online Full Spectrum Near Infrared Instrument
Features
- Stable optical system:The spectrometer developed independently for online near-infrared applications uses a gold-plated holographic fixed concave grating + electrically constant temperature cooling InGaAs diode 256 array detector, which has high sensitivity, no moving parts, and high stability.
- Advanced calibration system:Built-in high-precision linear stepper motor controls the reference standard diffuse reflector, which has good shock resistance and can ensure the long-term stability of the instrument's optical system
- Non-contact large spot irradiation:The non-contact detection method ensures that the instrument is not affected by the sample state, greatly prolongs the instrument life, and is easy to maintain; the effective spot diameter is about 100mm, which is very suitable for online detection of uneven samples
- Fast measurement speed:High-speed spectral data acquisition speed of more than 40 times/second can form big data analysis and statistical trend charts
- Rich software functions:Support online calibration modeling, model import and export, and configuration of multiple probes
- High cost performance:The instrument adopts a fully enclosed design, which can effectively eliminate the influence of stray light and the on-site environment, and uses positive pressure clean air to protect the lens. The light source has a long service life (more than 10,000 hours)
IR2100 Application of measuring sugar content of bayberry
Brix
Jan.1st
Jan.2nd
Jan.3rd
Jan.4th
Jan.5th
Average
Absolute error
10.6
10.1
10.1
10.3
10.2
10.3
10.2
0.4
11.2
11.5
11.4
11.5
11.6
11.6
11.5
0.3
12.5
12.8
12.9
13.0
12.8
12.9
12.9
0.4
13.4
13.6
13.8
13.8
13.7
13.8
13.7
0.3
The test results of bayberry show that the measurement error is within 0.5, which shows that the sweetness of bayberry can be accurately measured by IR2100.
By measuring the absorption spectrum of bayberry fruit to near-infrared light, a correlation model between sugar content and spectral data can be established to model the sweetness of bayberry.
IR2100 uses the principle of full-spectrum near-infrared. When measuring fruits, the sugar molecules in the fruits absorb the photon energy that matches their vibration frequency, thereby achieving a transition from the ground state to the excited state. It has a wide range of application scenarios in fruit sweetness measurement and agriculture.
- Stable optical system:The spectrometer developed independently for online near-infrared applications uses a gold-plated holographic fixed concave grating + electrically constant temperature cooling InGaAs diode 256 array detector, which has high sensitivity, no moving parts, and high stability.
- Advanced calibration system:Built-in high-precision linear stepper motor controls the reference standard diffuse reflector, which has good shock resistance and can ensure the long-term stability of the instrument's optical system
- Non-contact large spot irradiation:The non-contact detection method ensures that the instrument is not affected by the sample state, greatly prolongs the instrument life, and is easy to maintain; the effective spot diameter is about 100mm, which is very suitable for online detection of uneven samples
- Fast measurement speed:High-speed spectral data acquisition speed of more than 40 times/second can form big data analysis and statistical trend charts
- Rich software functions:Support online calibration modeling, model import and export, and configuration of multiple probes
- High cost performance:The instrument adopts a fully enclosed design, which can effectively eliminate the influence of stray light and the on-site environment, and uses positive pressure clean air to protect the lens. The light source has a long service life (more than 10,000 hours)
Brix | Jan.1st | Jan.2nd | Jan.3rd | Jan.4th | Jan.5th | Average | Absolute error |
10.6 | 10.1 | 10.1 | 10.3 | 10.2 | 10.3 | 10.2 | 0.4 |
11.2 | 11.5 | 11.4 | 11.5 | 11.6 | 11.6 | 11.5 | 0.3 |
12.5 | 12.8 | 12.9 | 13.0 | 12.8 | 12.9 | 12.9 | 0.4 |
13.4 | 13.6 | 13.8 | 13.8 | 13.7 | 13.8 | 13.7 | 0.3 |
By measuring the absorption spectrum of bayberry fruit to near-infrared light, a correlation model between sugar content and spectral data can be established to model the sweetness of bayberry.
IR2100 uses the principle of full-spectrum near-infrared. When measuring fruits, the sugar molecules in the fruits absorb the photon energy that matches their vibration frequency, thereby achieving a transition from the ground state to the excited state. It has a wide range of application scenarios in fruit sweetness measurement and agriculture.


Search
Categories
Popular Posts


Latest Posts


Comments: 0
No comments