
Your shopping cart is empty!
Using Hyperspectral Imager to Identifying Frozen Meals
This article discusses the use of hyperspectral imaging technology for identifying frozen meals. It highlights its ability to non-destructively analyze internal components and quality, improving detection efficiency and accuracy. The study demonstrates the technology's potential in food quality monitoring and its applications across various sectors.
1.Background
Convenient and tasty frozen meals have become popular among many restaurants due to their lower cost. However, during processing, storage, and transportation, frozen meals may face food safety issues such as microbial contamination, pesticide residues, and excessive additives. These concerns have consistently captured consumer attention.
Optosky's solution, based on hyperspectral imaging technology, effectively identifies the components of frozen meals, ensuring food safety and providing peace of mind for consumers!
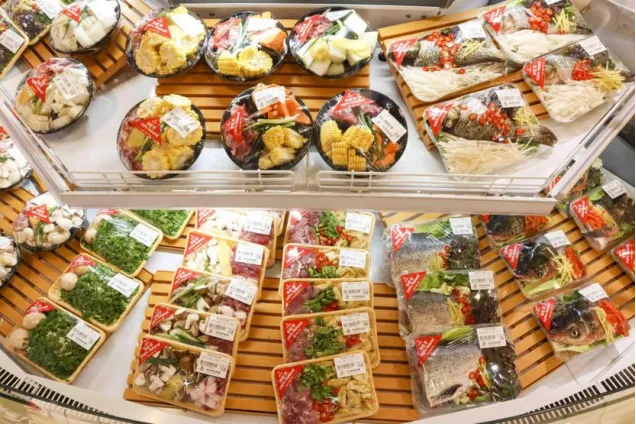
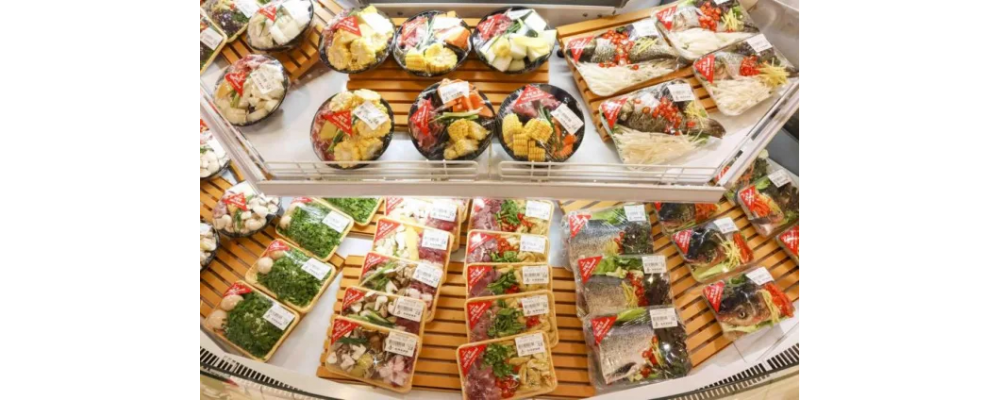
▲frozen meals
2.Experiment
Hyperspectral imaging technology combines the strengths of 2D imaging and spectral analysis, offering high resolution, large amounts of information, and fast detection speeds. By capturing images of frozen meal samples across multiple narrow bands of the electromagnetic spectrum, it enables non-contact, non-destructive detection of the sample's internal chemical composition, physical structure, and spatial distribution. This technology not only enhances detection efficiency and accuracy but also reduces potential risks to the environment and human health.
Sample Preparation and Imaging
Place the frozen meal sample flat or evenly on the ATH3500 to ensure that the surface is smooth and non-overlapping.1.Adjust the angles and distances of the hyperspectral camera and the light source to achieve optimal imaging results.2.Advantages: Non-destructive detection allows for maintaining the integrity of the sample while obtaining spatial distribution information for the entire sample, which helps detect internal inconsistencies.
Spectral Data Acquisition
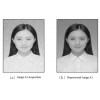
Activate the hyperspectral camera to capture spectral images of the sample across different wavelengths, from UV to near-infrared (400-2500nm). During the process, keep the light source stable to avoid interference from environmental factors.
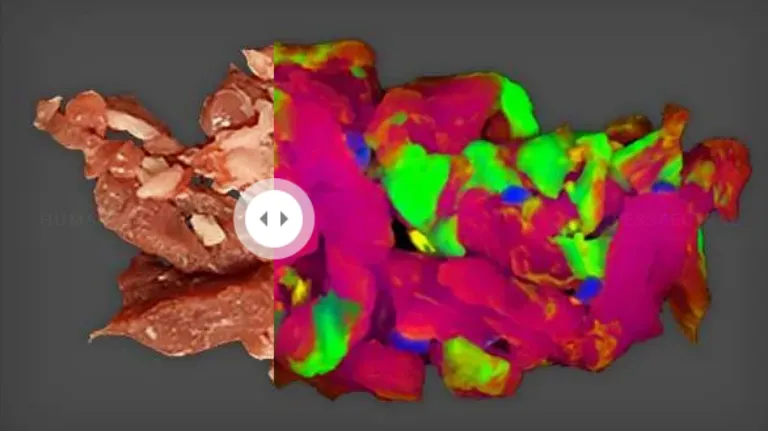
▲Hyperspectral Images of Ingredients
Advantages: The detailed spectral information provides rich chemical and physical data, enabling the differentiation of subtle compositional differences and detection of complex food ingredients.
Spectral Preprocessing
Perform standard normal variate (SNV) transformation on the collected raw spectral data to remove unnecessary spectral shifts. Apply first- or second-order derivatives to enhance spectral detail features. Use smoothing methods such as the Savitzky-Golay filter to reduce noise.
Advantages: Enhances data quality by reducing noise interference and improving the reliability of spectral signal analysis.
Feature Extraction and Selection
Using hyperspectral imaging technology, spectral information from frozen meal samples is analyzed to identify key components such as additives, preservatives, and seasonings. Principal Component Analysis (PCA) is employed to extract major components from the spectral data, reducing data dimensionality. Feature selection methods like Linear Discriminant Analysis (LDA) are applied to select key spectral bands for identification.
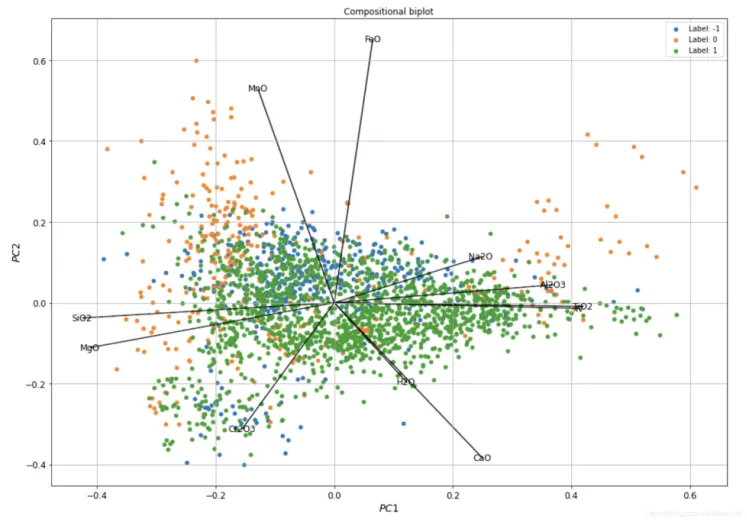
▲Mean Extraction of Principal Component Analysis (PCA)
PCA is a statistical method that transforms raw data (in this case, hyperspectral image data) into a set of new variables called principal components. These components are fewer in number but explain most of the variance in the data. In hyperspectral imaging, PCA can reduce high-dimensional data while retaining valuable information.
Component and Quality Analysis
Based on the extracted spectral features, analyze the sample's component information, including additives, preservatives, and seasonings. Assess quality indicators such as freshness and moisture content. By comparing with a standard database or known spectral features of frozen meal samples, determine the category and quality of the sample.
3. Solution Design
Hyperspectral Data Acquisition
Select representative frozen meal samples for analysis. Properly prepare the samples, such as cutting or removing shells, to facilitate detection by the hyperspectral imager. Use the hyperspectral imaging system to scan the frozen meal samples, capturing their spectral information across different wavelengths, including visible and near-infrared bands, to generate high-resolution spectral images.
Data Processing
Preprocess the acquired spectral images to remove noise and apply corrections to enhance accuracy and reliability. Use methods like chemometrics to extract spectral feature parameters such as absorption peaks and reflectance spectra for further analysis. Based on the extracted features, analyze the component information of the frozen meal samples, identifying additives, preservatives, and seasonings, and assess quality indicators like freshness and moisture content. Comparing these spectral characteristics with a standard database or known samples allows for preliminary classification and quality evaluation.
Hyperspectral Model Build:
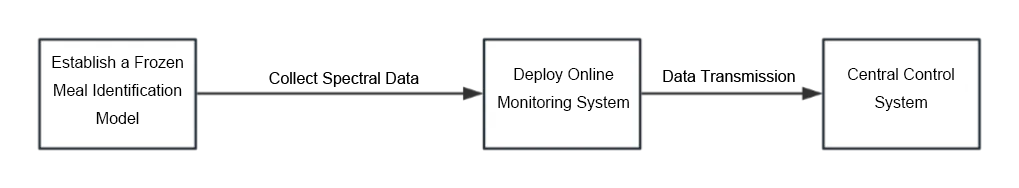
Build a frozen meal identification model using hyperspectral imaging technology. By collecting a large volume of spectral data from various samples and training the model with machine learning algorithms, the model’s recognition accuracy and generalization capabilities are enhanced. In practical applications, inputting the spectral data of a frozen meal sample into the model can quickly yield identification results.
This method is suitable for deployment in online hyperspectral monitoring systems to enable real-time quality control during the production of frozen meals. Configure the hyperspectral imaging system and data processing units to connect with the production line's control center. Set monitoring parameters and alarm thresholds for automatic monitoring and anomaly detection.
Real-time data transmission to the central control system for analysis and feedback:
Provide comprehensive analytical tools to meet the needs of various users. The system is easy to operate, enhancing usability and enabling quality control throughout the production process, ensuring product consistency. Quick responses to production anomalies improve the stability and efficiency of the production line.
4. Conclusion:
Hyperspectral imaging technology is an effective means for identifying frozen meals, enabling accurate differentiation among various types, qualities, or processing states of these products. Through spectral feature analysis, key information regarding the internal composition, freshness, and processing of frozen meals can be rapidly obtained. By analyzing the extracted spectral feature parameters, information about the components in the frozen meal samples can be assessed. Comparing these spectral characteristics with a standard database or known frozen meal samples allows for classification and quality evaluation. Hyperspectral imaging integrates spectral and image information, providing rich data support that enhances the comprehensiveness and depth of the analysis, thereby improving the accuracy and reliability of identifications.
Product Recommendation:
ATH3500
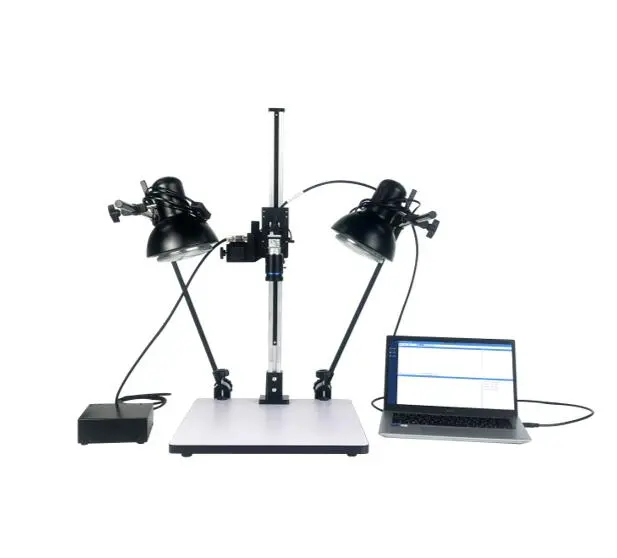
Product Features:
- High-sensitivity hyperspectral imager with high-performance image sensors, offering excellent cost-effectiveness.
- Stable platform with motor control for external push-broom imaging.
- Comprehensive imaging quality optical design with a spot size diameter of less than 0.5 pixels.
- Standard C-Mount objective interface for interchangeable lenses according to user needs.
- Wavelength range: 400-1000nm (customizable).
- High spectral resolution: 1.3nm @ 696nm.
- Field of view: 11.46° @ 35mm (interchangeable focal length).
- Superior imaging performance.
Application Areas:
- Agricultural Applications: Pest and disease monitoring, nutrient monitoring, disaster assessment, and crop yield estimation.
- Forestry Applications: Species identification, biomass estimation, nutrient element monitoring, and forest health assessment.
- Water Environment Applications: Water quality parameter inversion, spatial distribution and migration characteristics of water pollution.
- Soil Monitoring: Soil impurity identification, soil moisture monitoring, and soil fertility assessment.
- Geological Applications: Mineral composition detection and mineralization prediction.
- Urban Applications: Surface change detection, road monitoring, ground object identification, and environmental monitoring.

-100x100.jpg)

Search
Categories
Popular Posts


Latest Posts


Comments: 0
No comments