
Your shopping cart is empty!
Fluorescence Principles and Analysis Techniques
This article explains the basics of fluorescence and key analysis techniques used to detect molecules and study reactions in fields like biology and chemistry. Ideal for those seeking a quick overview of fluorescence principles and applications.
Basic Principles of Fluorescence
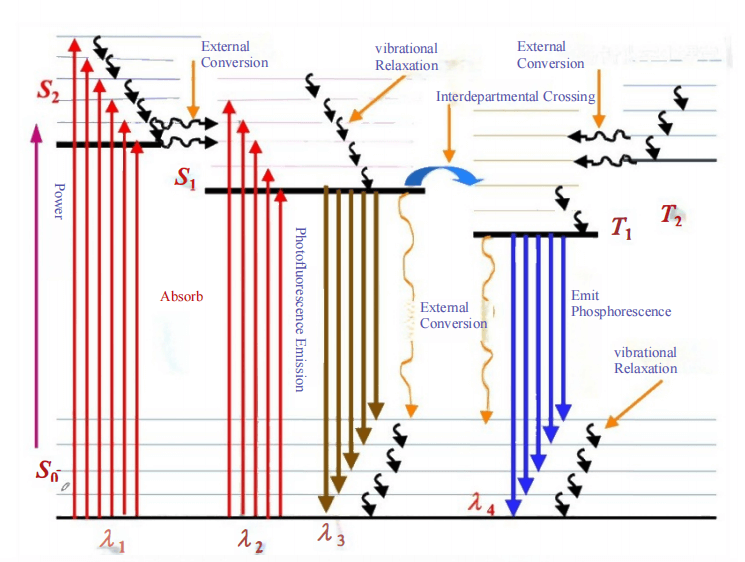
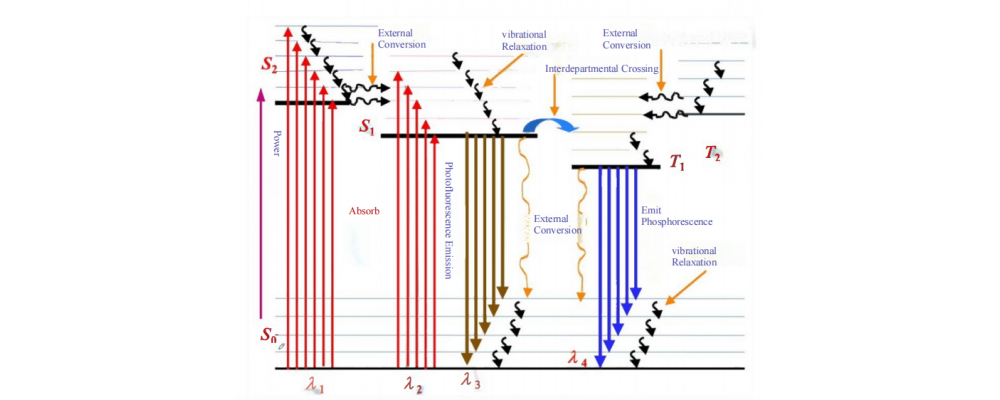
Fluorescence is a type of radiative transition, occurring when a substance releases radiation as it deactivates from an excited state to a lower energy state with the same multiplicity. From a microscopic perspective, when molecules absorb photons through light exposure, their electrons are excited from lower energy levels to higher energy levels. These molecules then return to their ground state through a process involving radiative or non-radiative transitions, emitting photons in the process, which results in fluorescence or phosphorescence.Fluorescence emission occurs simultaneously with radiation, and when the radiation stops, fluorescence quickly fades. Phosphorescence, however, has a time delay between photon absorption and reaching peak intensity, and the emission continues for a short period even after radiation ceases.
Fluorescence Testing Methods
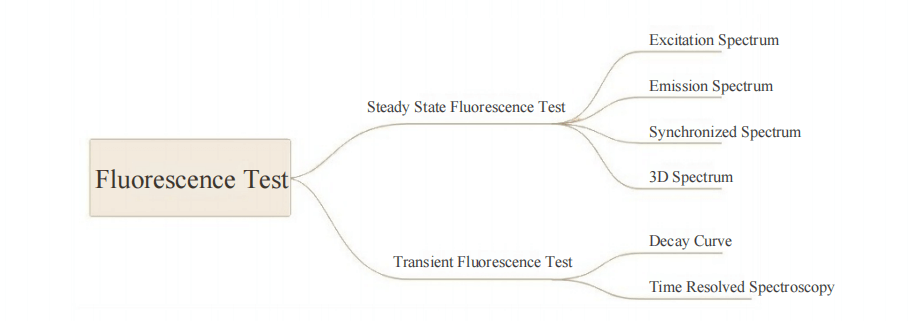
Fluorescence can be categorized into two main types based on time-domain analysis: steady-state fluorescence and time-resolved fluorescence testing. Fluorescence spectroscopy is versatile, suitable for analyzing various samples including solid powders, crystals, films, and liquids. For optimal results, quartz cuvettes are used for liquid samples, while solid sample holders are employed for powders or solid specimens.Building on steady-state and time-resolved fluorescence, fluorescence spectroscopy can be coupled with microscopy to achieve micro-area analysis results. This approach allows for the investigation of samples under varying external conditions, such as different temperatures, pressures, and magnetic fields, providing detailed fluorescence spectra.
2D Fluorescence Spectroscopy
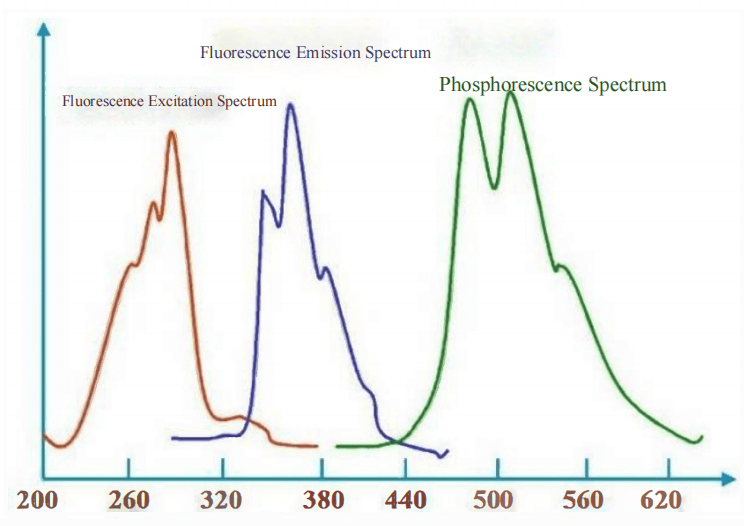
Two-dimensional fluorescence spectroscopy primarily encompasses fluorescence emission spectra and excitation spectra.Fluorescence emission spectra involve exciting a substance with a fixed incident wavelength and measuring the distribution of fluorescence intensity across different emission wavelengths. This method provides insights into the fluorescence properties of the material under specific excitation conditions.Fluorescence excitation spectra focus on detecting the fluorescence intensity as a function of varying incident wavelengths, while keeping the emission wavelength constant. This approach helps to understand how different wavelengths of light excite the material.Conventional fluorescence analysis techniques are used for the qualitative and quantitative analysis of both inorganic and organic compounds. These methods are essential in chemical research, pharmaceutical development, and environmental studies, offering detailed insights into the composition and behavior of various substances.Recent technical trends in this area include advancements in high-resolution 2D fluorescence spectroscopy and integrated fluorescence imaging systems, enhancing the accuracy and scope of fluorescence measurements. Keywords like "advanced fluorescence emission spectra," "high-sensitivity excitation spectra," and "2D fluorescence analysis techniques" are driving current innovations and applications in the field.
Synchronised Fluorescence Spectroscopy
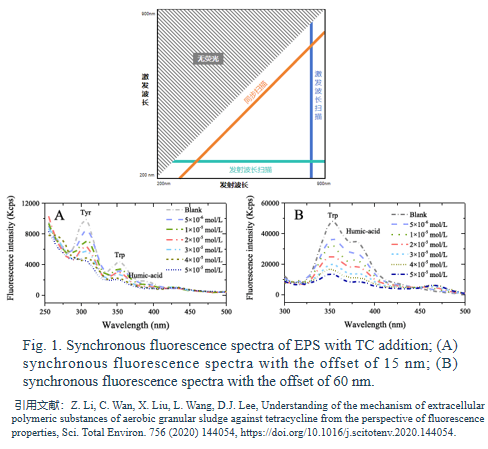
Synchronised fluorescence analysis, first introduced by Lloyd, is a sophisticated method that leverages both absorption and emission characteristics of compounds to improve the selectivity of spectral analysis. This technique is distinguished by its ability to enhance the intensity of strong fluorescence bands while reducing interference from weaker bands, effectively minimizing Rayleigh scattering and Raman signal broadening.Synchronised fluorescence analysis can be categorized into several methods:- Constant (Fixed) Wavelength Method: Maintains a constant wavelength difference between excitation and emission.
- Constant Energy Method: Keeps the energy difference between excitation and emission wavelengths constant.
- Variable Angle Method: Adjusts the angle of detection to optimize signal collection.
- Constant Baseline Method: Ensures a stable baseline for more accurate measurement
These methods make synchronised fluorescence spectroscopy highly effective for analyzing complex mixtures. It is widely used in various fields, including:
- Environmental monitoring: Detecting and quantifying pollutants.
- Pharmaceuticals: Analyzing drug formulations and interactions.
- Clinical diagnostics: Identifying biomarkers and disease markers.
- Chemical industry: Monitoring chemical processes and product quality.
3D Fluorescence Spectroscopy
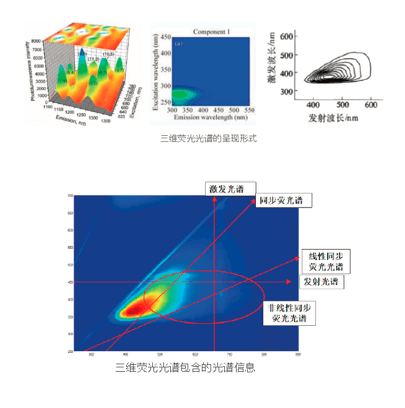
Three-dimensional fluorescence spectroscopy is a modern technique developed in recent decades that extends the capabilities of traditional fluorescence methods. It analyzes fluorescence intensity as a function of both excitation and emission wavelengths, producing a comprehensive 3D fluorescence spectrum. This method creates a detailed spectral map that provides more complete information than conventional or synchronised fluorescence spectroscopy.The technique serves as a valuable spectral fingerprinting tool, allowing for the identification and quantification of multiple components within a complex mixture. Each component has distinct absorption and emission characteristics, making it possible to detect all components in a single scan.3D fluorescence spectroscopy is widely applied in various fields, including environmental monitoring for assessing dissolved organic matter and pollutants, clinical chemistry for differentiating cancerous from non-cancerous cells based on fluorescence of metabolic products, and bacterial identification. It is also used in photochemical reaction monitoring and the qualitative and quantitative analysis of multi-component mixtures.
Fluorescence Quantum Yield
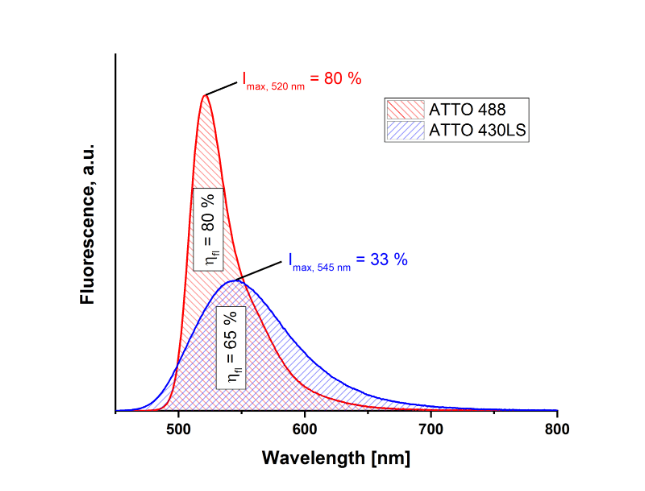
Fluorescence quantum yield (φf) is a fundamental parameter that quantifies the efficiency of fluorescence emission by a substance. It is defined as the ratio of the number of photons emitted to the number of photons absorbed, with values ranging from 0 to 1. The quantum yield depends on the chemical structure of the fluorescent molecule and its surrounding environment, such as temperature, pH, and solvent.To measure fluorescence quantum yield, various methods are used, with the most common being the referencing method. This approach involves comparing the fluorescence of the substance in question with that of a reference substance with a known quantum yield. Both samples are prepared in dilute solutions and measured under identical excitation conditions. The comparison is based on the integrated fluorescence intensity (the area under the corrected emission spectrum) and the absorbance at the excitation wavelength.Fluorescence quantum yield measurements provide valuable information about a substance's optical properties and chemical composition. This data is crucial across numerous fields, including materials science, where it aids in evaluating new materials; biological sciences, for studying biomolecules; medicine, for developing diagnostic tools; optical devices, for enhancing performance; and energy science, for improving energy conversion materials.


Related Products

30.00″W x 40.00″D x 18.00″H
ATR3020
Search
Categories
Popular Posts


Latest Posts


Comments: 0
No comments