
Your shopping cart is empty!
Evaluating Chilean Grapes and Wine Quality with A-TEEM Technology
This article discusses how A-TEEM technology assesses the quality of Chilean grapes and wines, offering precise analysis to enhance production standards and ensure superior quality.
Introduction
Chile, the world's longest and narrowest country, stretches from the arid Atacama Desert in the north to the southern Tierra del Fuego and the Drake Passage. This unique geography, bordered by the Andes Mountains and the Pacific Ocean, results in a diverse range of landscapes including deserts, beaches, fjords, volcanoes, snow-capped mountains, lakes, forests, ice fields, and glaciers. These varied terrains contribute to Chile's fertile soils and renowned vineyards.De Martino Winery is Latin America's largest wine producer, established in 1883. Headquartered in Santiago, Chile, it operates 21,500 acres of vineyards across eight major valleys. From the dry and temperate Limarí Valley in the north to the rainier and cooler Biobío Valley in the south, soil, plant material, and cultivation methods impact grape quality. Efficient vineyard management is crucial for De Martino, which has turned to technology to enhance its grape and wine management systems.
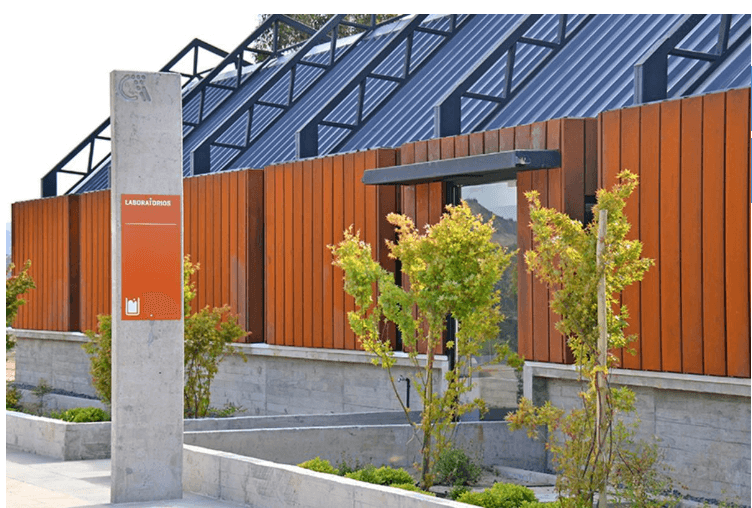
De Martino Winery Research and Innovation Center
Located in Talca, three hours south of Santiago, the center emphasizes its role in agricultural and viticultural advancements. Founded in 2014, the center features a state-of-the-art laboratory and experimental wine cellar, focusing on research in viticulture, winemaking, molecular biology, and engineering. Its mission is to drive applied research, technical development, and knowledge transfer to produce high-quality, competitive wines in the dynamic international market.
Utilizing Scientific Technology to Assess Grape and Wine Quality
Researchers at the CRI Research and Innovation Center have been tackling the challenge of classifying grapes and wines based on their quality. They have employed spectroscopy technology to analyze compounds in grapes and wines that contribute to unique characteristics such as color, flavor, mouthfeel, and aroma. After three years of research on chemical quality markers and method development, their pilot project has scaled to an industrial level with promising results. The CRI now aims to integrate this method into commercial winery wine quality control processes, extending beyond just research and development.“Overall, this method is more objective,” says Dr. Doreen Schober, a researcher at De Martino Winery. By analyzing the chemical composition of grapes to predict wine quality, the approach minimizes external influences and provides winemakers with valuable data for decision-making during the winemaking process.De Martino’s grapes, sourced from their own vineyards or purchased from producers, vary in type. Traditionally, grape quality assessment has relied on internal experts evaluating cultivation characteristics and key components like sugars. However, the most accurate and objective quality assessment comes from analyzing grape chemical profiles.Indeed, the wine industry in Australia and California has been researching for over a decade to establish standards for grape chemical quality markers, aiming to optimize the winemaking process (Bindon et al., 2020; Cleary et al., 2015). These markers include various polyphenolic compounds, aroma components, and maturity parameters.Dr. Schober states, “These key markers in grapes can help us predict wine quality.” By analyzing the chemical composition of different grapes and wine samples in their experimental wine cellar, the CRI aims to develop predictive models for wine quality based on this foundational data.
Doreen Schober, Ph.D.
Limitations of Traditional Testing Technologies
In the winemaking industry, traditional analysis methods such as High-Performance Liquid Chromatography (HPLC) and Gas Chromatography (GC) have been used to characterize grape compounds. However, these methods are often slow, costly, time-consuming, and environmentally unfriendly due to the large amounts of consumables required.“De Martino Winery has discovered alternative technologies for characterizing grapes and wines,” says Jorge Zincker, head of the CRI Laboratory. “This approach is localized, rapid, accurate, cost-effective, and sustainable. We can test grapes on-site upon arrival, quickly obtain information about their chemical composition, infer their quality potential, and determine their corresponding winemaking processes and future wine brands. If necessary, we can even adjust the winemaking process.” Essentially, this is a grape classification method.Schober adds, “Even if grapes are cultivated to meet specific quality levels or wine brands, they still require quality testing and classification to finalize wine batches or brands.”This classification is crucial as De Martino Winery produces a wide range of wines from premium to high-end varieties. Grapes and wines are categorized into six quality classes, with winemakers using three subcategories for adjustments based on sensory evaluations.
Shifting Research Focus to Spectral Testing Technologies
To expedite this complex process, a digital platform was developed to manage grape quality as part of a pilot study. This platform tracks grapes from their origin, through 100,000 liters of wine bottling, and records both their chemical composition and final wine quality. It connects all participants in the production chain, including grape growers, winemakers, and laboratories.“Even grapes from the same vineyard can vary due to different harvest seasons and factors like climate. To produce excellent wine, it’s essential to understand their characteristics promptly,” says Schober.Currently, De Martino’s pilot project uses fluorescence spectroscopy and an automatic sampler to monitor grape quality at the start of winemaking and to check wine characteristics before blending different batches. The fluorescence spectrometer also features a new multi-component wine prediction tool (HMMP), developed by chemometrics experts. This tool aids in evaluating photometric measurements, automatically imports absorbance and fluorescence data, performs necessary spectral corrections, and outputs compound concentrations and sample quality classifications. Analysts simply select the required sample measurements and predefined predictive models, making this technology ideal for commercial winery daily use.
Fluorescence spectroscopy evaluates wine characteristics effectively
A-TEEM (Absorbance-Transmission and Fluorescence Excitation-Emission Matrix) technology offers a fast and comprehensive characterization method for commercial wine processing and quality. Using a fluorescence spectrometer, it provides complete UV-visible spectra, including industry-standard absorption wavelengths at 280, 420, 520, and 620 nm. These wavelengths are crucial for assessing wine’s phenol content, color tone, and concentration.In addition, combining absorbance and fluorescence EEM (Excitation-Emission Matrix) data helps evaluate grape batches, regional and varietal characteristics, and the impact of oxidation treatments and sulfur dioxide treatments on wine. This makes fluorescence and absorbance spectroscopy essential tools for industrial wine characterization.Real-world application examples showcase the effectiveness of A-TEEM technology in optimizing wine quality control processes.
Application
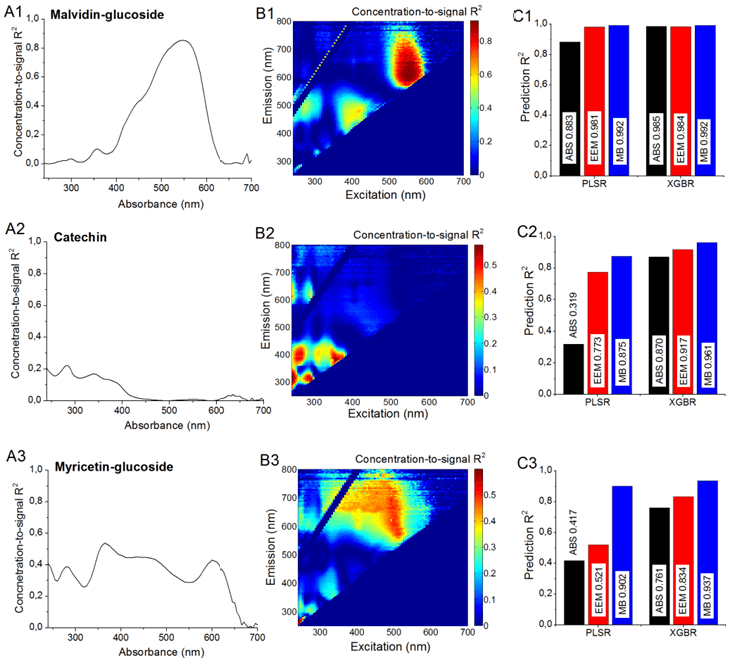
Figure 1. Component-Specific Correlation of Wine Absorbance and Fluorescence EEM Data
Figure 1 illustrates the use of A-TEEM spectroscopy as an innovative, rapid quantitative analysis method. It evaluates 44 distinct phenolic and basic wine chemical compounds, which are crucial quality parameters in the wine industry. This spectral analysis technique enhances the quality assessment and control processes in commercial wine production.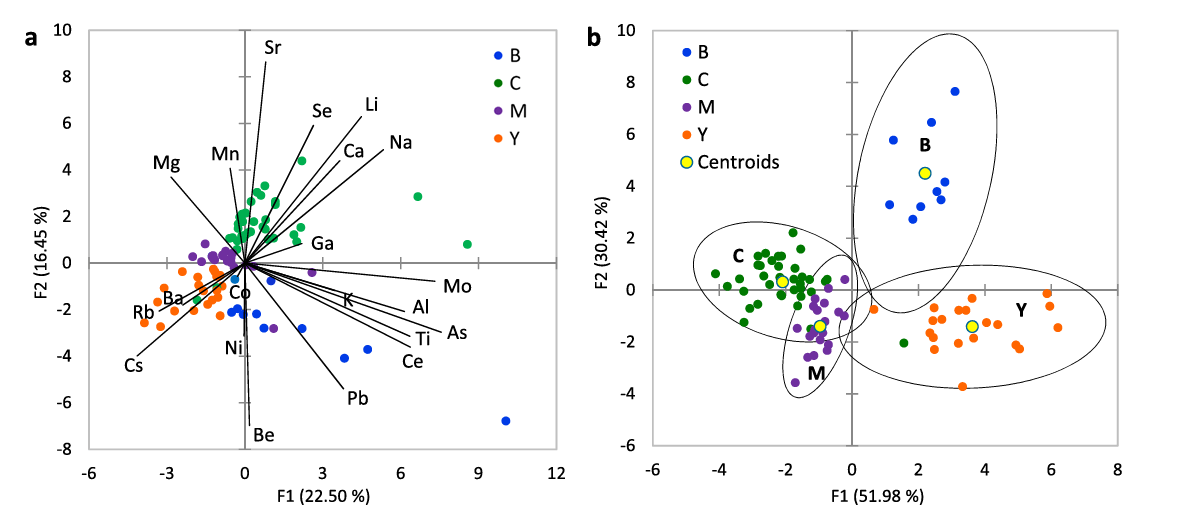
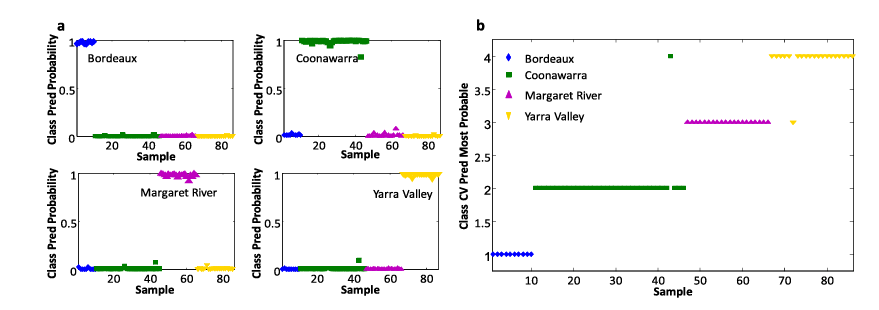
Figure 2. XGBDA Analysis of Key Multivariate Data from ICP-MS for Wines from Different RegionsFigure 2 presents XGBDA (Extreme Gradient Boosting Data Analysis) of critical multivariate data from ICP-MS (Inductively Coupled Plasma Mass Spectrometry). The PCA (Principal Component Analysis) dual plots show scores and variable loadings for wine samples from various regions, highlighting significant differences in elemental composition. This data analysis technique aids in understanding regional wine characteristics and enhances wine quality control in the wine industry.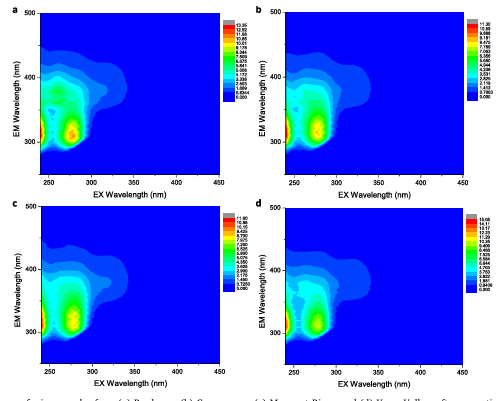
Figure 3. EEM Profiles of Wine Samples from Different RegionsWith the increasing risk of wine fraud, rapid and simple wine authentication methods have become essential in the global wine industry. Compared to Inductively Coupled Plasma Mass Spectrometry (ICP-MS), the study explored using fluorescence data from Absorbance-Transmission and Fluorescence Excitation-Emission Matrix (A-TEEM) technology to distinguish wines by region. Figures 2 and 3 illustrate the application of these methods to commercial Cabernet Sauvignon wines from the 2015 vintage sourced from three Australian wine regions and Bordeaux, France.Multivariate algorithms such as Extreme Gradient Boosting Discriminant Analysis (XGBDA) were evaluated alongside other wine classification techniques. The models were cross-validated, with performance described based on sensitivity, specificity, and accuracy. XGBDA classification achieved 100% correct category assignment for all test regions using EEM data, compared to a 97.7% overall classification rate with ICP-MS.In summary, A-TEEM analysis technology shows promising potential in assessing the quality of Chilean grapes and wines, especially in adapting to rapidly changing market environments, providing accurate wine authentication, and enhancing production efficiency.


Search
Categories
Popular Posts


Latest Posts


Comments: 0
No comments