
Your shopping cart is empty!
Solution | Example of Visible-Near Infrared (Vis-NIR) Fiber Optic Spectrometer in Transmittance Applications
This article presents a cost-effective Vis-NIR spectrometer using a CMOS sensor, covering 200-1100 nm with 2.0 nm resolution. It details the device's design and application in measuring transmittance in glass samples using Optosky's ATP2400 spectrometer, highlighting its precision and reliability.
This article presents a cost-effective Vis-NIR spectrometer using a CMOS sensor, covering 200-1100 nm with 2.0 nm resolution. It details the device's design and application in measuring transmittance in glass samples using Optosky's ATP2400 spectrometer, highlighting its precision and reliability.
1. Visible-Near Infrared Fiber Optic SpectrometerSpectrometers are a crucial component of optical instruments, used to measure, analyze, and process the structure and composition of materials based on optical principles. They offer high analytical precision, a broad measurement range, and fast processing speeds.Currently, most visible-near infrared (Vis-NIR) spectrometers on the market use back-thinned or coated CCDs as the photosensitive elements, which are typically expensive. This article proposes a cost-effective design that incorporates a CMOS sensor chip into a Vis-NIR spectrometer. The system employs optical fibers as light-guiding components and uses a grating for light dispersion. The dispersed light is then projected in parallel onto the sensor’s surface, where it is converted into electrical signals. These signals are subsequently digitized by the circuit's A/D conversion, stored, and transmitted to a host computer, where spectral images are displayed and analyzed.In this design, to ensure that the sensor’s photosensitive element receives a uniform, high-resolution monochromatic light beam, a well-sized optical system must be constructed. The experimental results demonstrate that the Vis-NIR fiber optic spectrometer designed using this approach exhibits excellent sensitivity in the visible spectrum, with a spectral range of 200 nm to 1100 nm and a resolution of up to 2.0 nm.
2. Application PrincipleFirstly, the light emitted from the source is transmitted to the spectrometer through an optical fiber. The introduction of the optical fiber makes the sampling method more flexible, allowing it to adapt to the complex shapes and positions of the samples being measured. When light is incident on transparent materials such as glass, it exhibits three properties: reflection, absorption, and transmission. Transmitted light refers to the portion of light that passes through the material after subtracting the losses from reflection and absorption. The change in light energy before and after passing through the material represents the material’s transmittance, which is expressed as the transmittance value.Inside the spectrometer, the optical signal first passes through an entrance slit and is projected onto a collimating lens. The slit limits the range of light entering the spectrometer, while the collimating lens converts the divergent light into a nearly parallel beam. This parallel light is then projected onto a dispersive element, typically a diffraction grating. The grating’s function is to disperse the light into different wavelengths, forming a spectrum. This dispersion process is based on the wave nature of light and the interference effect, where different wavelengths of light produce different diffraction angles when interacting with the grating, thereby achieving spectral separation.The dispersed light is then reflected and imaged onto the receiving surface of an array detector by an imaging mirror. Each pixel corresponds to a small spectral band within the spectrum, enabling the measurement of the entire spectrum. The detector analyzes the optical signal to obtain spectral information. Through the analysis and processing of this spectral information, the spectral characteristics and related parameters of the measured substance, including transmittance, can be obtained.In summary, the principle of applying a visible fiber optic spectrometer for transmittance measurement involves optical interference, dispersion, and the transmission properties of light. The optical fiber transmits the optical signal into the spectrometer, where the grating disperses the light and the detector measures it, providing spectral information such as the transmittance of the material. This method has broad application value in material science and optical research. The selected spectrometer for this instrument has a wavelength range of 200-1110 nm, a wavelength accuracy of ±0.5 nm, and a wavelength repeatability of ±0.1 nm (with a wavelength temperature drift of 0.4 nm/10℃).
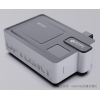
3. Samples and Testing MethodThe samples for this test include five types of test samples: five different filter types with varying transmission positions. The testing was conducted using the ATP2400 visible near-infrared miniature fiber optic spectrometer, produced by Optosky (Xiamen) Photonics Inc.Testing Conditions:· Integration time: 80 µs· Averaging: 5 times· Scanning range: 200-1110 nm· Room temperature4. Test Results and Analysis
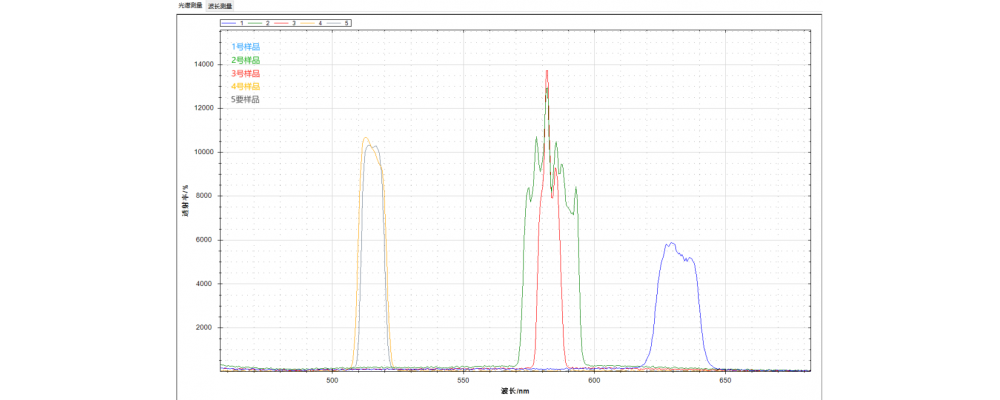
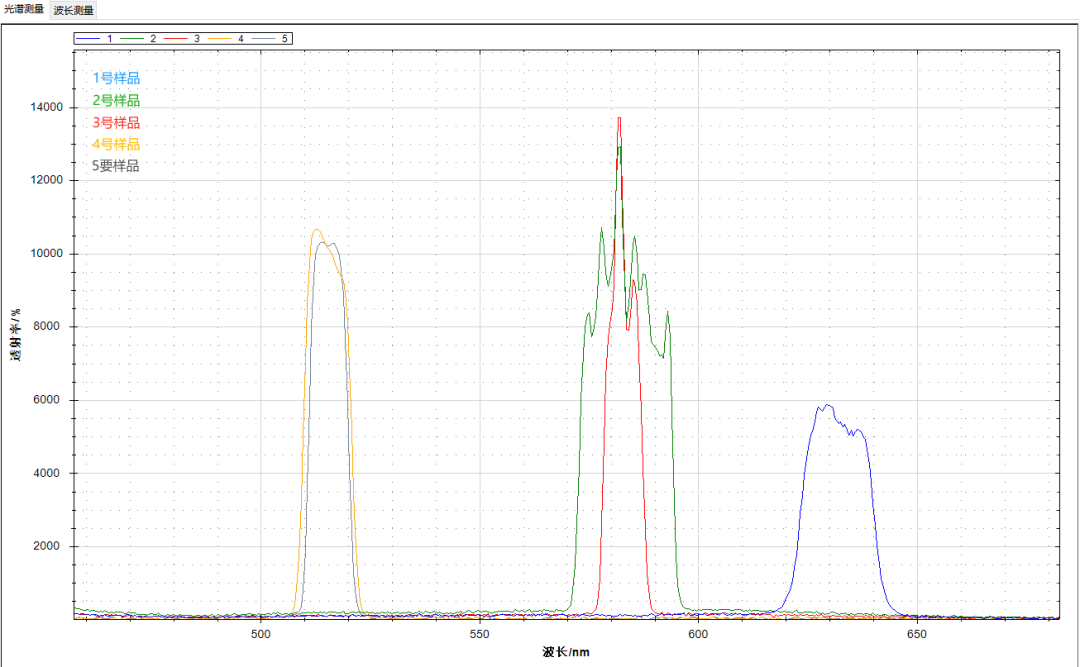
4.1 Sample Relative Intensity Comparison
4.2 Sample Transmittance Comparison
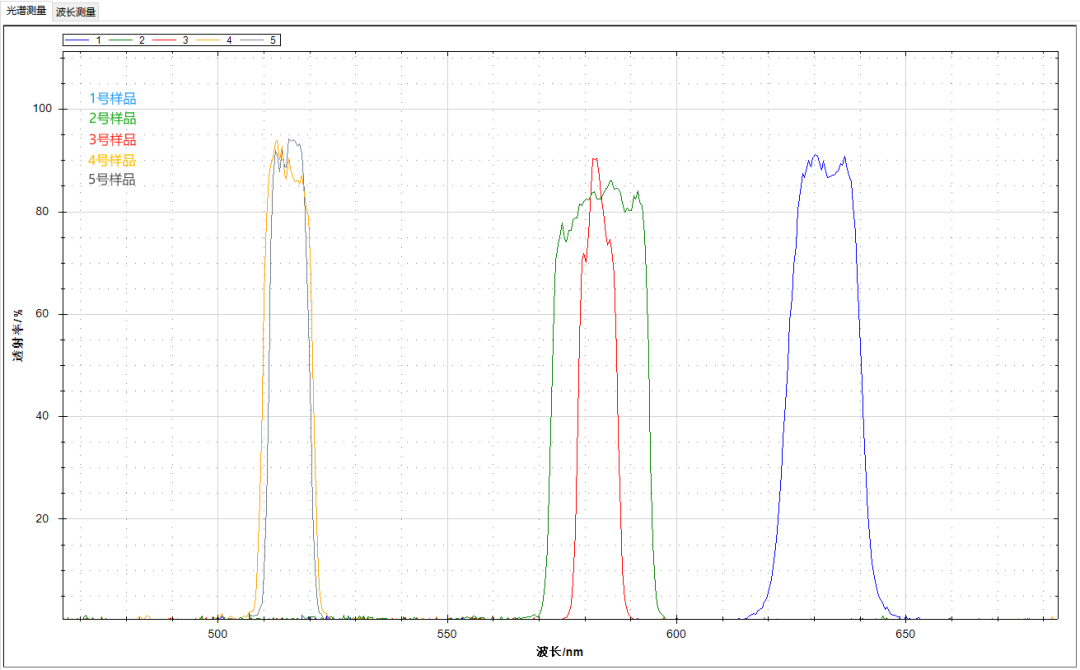
Sample | 1 | 2 | 3 | 4 | 5 |
Position | 630nm | 580nm | 580nm | 515nm | 515nm |
Transmittance(%) | 96 | 86 | 90 | 94 | 92 |
5. Conclusion
The conclusions drawn from transmittance testing are primarily dependent on the specific testing conditions, the test samples, and the performance of the spectrometer used. In this study, transmittance tests were conducted on five glass samples using the ATP2400 fiber optic spectrometer from Optosky.
In the 500-700 nm wavelength range, the transmittance of these four glass samples was generally high, but the differences between them were relatively small. Specifically, the transmittance positions of Samples 2 and 3 were quite close, with a transmittance difference of approximately 4%. Similarly, the transmittance positions of Samples 4 and 5 were almost identical, with a transmittance difference of about 2%. However, Sample 1 exhibited significant differences in both transmittance position and transmittance values compared to the other samples. This does not necessarily imply that the performance differences of these samples in this wavelength range are insignificant; the significance of these differences must be evaluated based on specific application scenarios and requirements.
Additionally, the conclusions of the transmittance tests are also influenced by the performance of the spectrometer. The Optosky ATP2400 fiber optic spectrometer features a compact design, configurable spectral range, high resolution, and low stray light, all of which contribute to more accurate and reliable transmittance test results.
In summary, the conclusions regarding transmittance testing need to be comprehensively assessed based on specific testing conditions, samples, and spectrometer performance. In practical applications, other factors such as sample thickness, surface condition, and light source stability should also be considered to obtain more comprehensive and accurate transmittance test results.


Search
Categories
Popular Posts


Latest Posts


Comments: 0
No comments