
Your shopping cart is empty!
How to design the uv spectrometer analysis system?
Ultraviolet light refers to electromagnetic waves with a wavelength of 200~400 nm. By analyzing the response characteristics of ultraviolet light to specific substances and combining with the spectral absorption algorithm, qualitative and quantitative analysis of specific substances can be realized, which has the advantages of less sample consumption, faster analysis speed and higher stability of results, and has been widely used in pharmaceutical, medical and health, chemical, food, environmental protection, agriculture and other fields.
The traditional ULTRAVIOLET spectrum analyzer is composed of coating optical device, plane grating and linear array detector. However, due to the unique characteristics of ULTRAVIOLET light, ordinary coated optical devices have low reflectance in the ultraviolet spectral band. At the same time, the diffraction efficiency of planar grating is low and the optical path grows, resulting in the attenuation of light intensity and the reduction of the signal-to-noise ratio of spectrometers. Therefore, this paper proposes an ULTRAVIOLET spectral analyzer based on holographic concave grating. The holographic concave grating is used to accomplish the spectroscopic and imaging of the incident light at the same time, which reduces the number of reflectors, greatly shorens the optical path of the system, and effectively improves the signal-to-noise ratio of the micro-ultraviolet spectrum analyzer.
At present, scholars at home and abroad have done a lot of research on miniaturized ULTRAVIOLET spectrometers:
HAMAMATSU of Japan mainly promoted TM series in the ultraviolet band. This series adopts transmission grating and unrefrigerated back-light CCD image sensor, with high resolution and sensitivity. However, transmission grating has low transmittance and diffraction efficiency and is difficult to produce.
Maya series micro-ultraviolet spectrometers developed by Ocean Optics of the United States adopt asymmetric optical structure design, with the quantum conversion rate up to 90% and the resolution up to 0.1nm, which is very suitable for applications with high sensitivity. However, C-T structure requires more optical devices, which makes it more difficult to install and adjust. Moreover, the high price of these products makes it difficult to promote.
Domestic UV spectrometer products are mainly from Shanghai Fuxiang Company, whose FX2000 is a typical representative of UV spectrometer, but it has the disadvantages of unstable spectral data output and low signal noise.
The micro-ultraviolet spectrometer developed in this paper USES holographic concave grating, which can integrate spectroscopic and imaging, effectively reduce system aberration, improve signal-to-noise ratio and resolution, reduce instrument cost, and meet the market requirements for portable, on-line real-time monitoring, and easy to secondary development of ultraviolet spectrum analyzer.
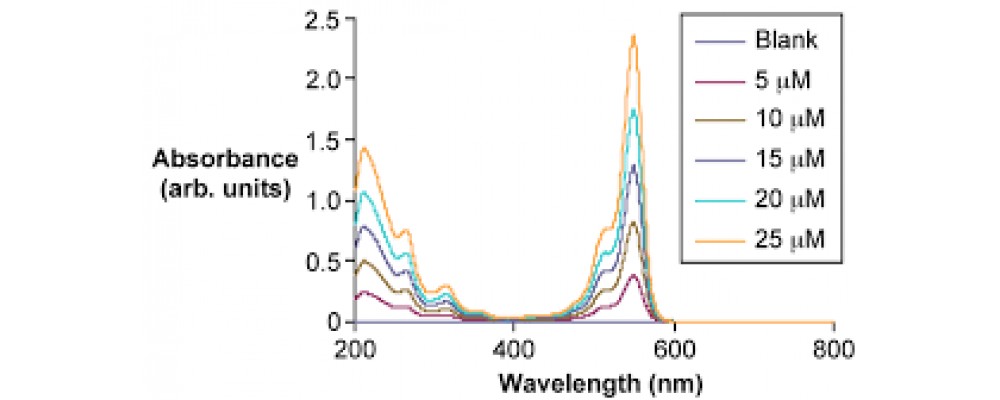
Based on the specific requirements of flue gas analyzer, this paper analyzes the absorption characteristics of SO2 in the band of 200-400 nm, takes holographic concave grating as the core optical device, builds a test prototype and test platform of ultraviolet spectrum analyzer in combination with the practical application environment, and conducts relevant performance tests and application experiments.
Operating principle of UV spectrum analysis system:
Ultraviolet spectrum detection technology is used to measure the light in the ultraviolet region, ultraviolet wavelengths are the characteristics of short, high energy, when the pollutants absorbed light, its electronic shift in the molecule, the resulting molecular absorption spectrum is called the ultraviolet absorption spectrum, the spectrum is the electron transition spectra, absorption wavelength range of 200 ~ 400 nm, due to the uv absorption spectrum absorption energy is greater than the infrared absorption spectrum, and it is easy to detect the change of the absorption, thus can be used in the structure identification and quantitative analysis. The general work of ULTRAVIOLET spectrum detection technology is to measure the sample data with the spectrometer, which reflects the composition or material state information of the sample. Then the composition or state information of the sample is measured by the standard reference method, and then the two groups of measured data are used to establish the calibration model. At last, the composition or properties of the unknown samples are analyzed by the rapid prediction of the spectral determination and the established calibration model.

Search
Categories
Popular Posts


Latest Posts


Comments: 0
No comments