

Your shopping cart is empty!

From Color to Flavor: Hyperspectral Imaging Decodes Coffee Ripeness-2
Learn how hyperspectral imaging with PLS‑DA and SNV preprocessing achieves 95% accuracy in coffee ripeness detection, predicts sugars and quality traits, and paves the way for drone‑based smart harvesting.
Traditional coffee ripeness assessment relies mainly on manual observation of peel color, classifying cherries into green, yellowish‑green, red, dark red, and other stages. However, color is only an external manifestation of ripeness and cannot accurately reflect the internal changes in sugars, acids, amino acids, fatty acids, and other flavor precursors. Therefore, relying solely on human experience for harvesting often leads to inconsistent maturity and compromised specialty coffee quality. Hyperspectral imaging offers a way to "see inside" the fruit. It combines machine vision with spectral analysis – not only capturing fruit images but also recording hundreds of continuous reflectance spectra for every pixel simultaneously, enabling truly non‑destructive detection. 01 Acquiring Hyperspectral Data of Coffee Cherries
The study used a 398.5–1002.2 nm visible‑near‑infrared hyperspectral imaging system to scan Yunnan arabica coffee cherries at different maturity levels. The main components include:Hyperspectral cameraCCD detectorImaging lensHalogen tungsten light sourcesMotorized scanning stage Data acquisition software During acquisition, two 45° halogen lamps provide uniform illumination. Coffee cherries are placed on a moving stage that passes through the camera's field of view at a constant speed. The hyperspectral camera performs push‑broom scanning line by line, finally generating a three‑dimensional data cube (hyperspectral cube) containing 176 continuous bands. In simple terms, each coffee cherry not only has a "photo" but also a complete "spectral ID card.". 02 Using Different Wavelength Bands to Reflect Ripening Changes
As coffee cherries ripen, the pigments, sugars, moisture, and organic acids all change, and these changes affect the absorption and reflection of light at different wavelengths. For example:① Visible band (400–700 nm)This band mainly reflects changes in peel color.At early ripening, chlorophyll content in the peel is high, so absorption of red and blue light is strong, and overall reflectance is low.As ripening proceeds:Chlorophyll degrades continuouslyAnthocyanins accumulate graduallyPeel color changes from green to bright red Thus, in the 500–650 nm region, different maturity stages show distinctly different spectral curves. In particular, the red‑edge region near 650–700 nm is an important spectral feature for ripeness assessment. ② Near‑infrared band (700–1000 nm)The NIR region reflects more internal quality attributes.With ripening:Moisture gradually decreasesSoluble solids increaseTotal sugars accumulateOrganic acids changeFatty acids are redistributed These chemical changes alter the absorption characteristics in the NIR region. For example:Near 970 nm – water absorption750–800 nm – lipid‑related information950–980 nm – reflects changes in sugars, moisture, and other flavor precursors Thus, even if two cherries look similar in color, their spectral information can still reveal differences in internal ripeness. 03 Spectral Preprocessing to Improve Recognition Accuracy
Raw spectra are inevitably affected by:Uneven illuminationDifferent fruit sizesSurface scatteringEnvironmental noise
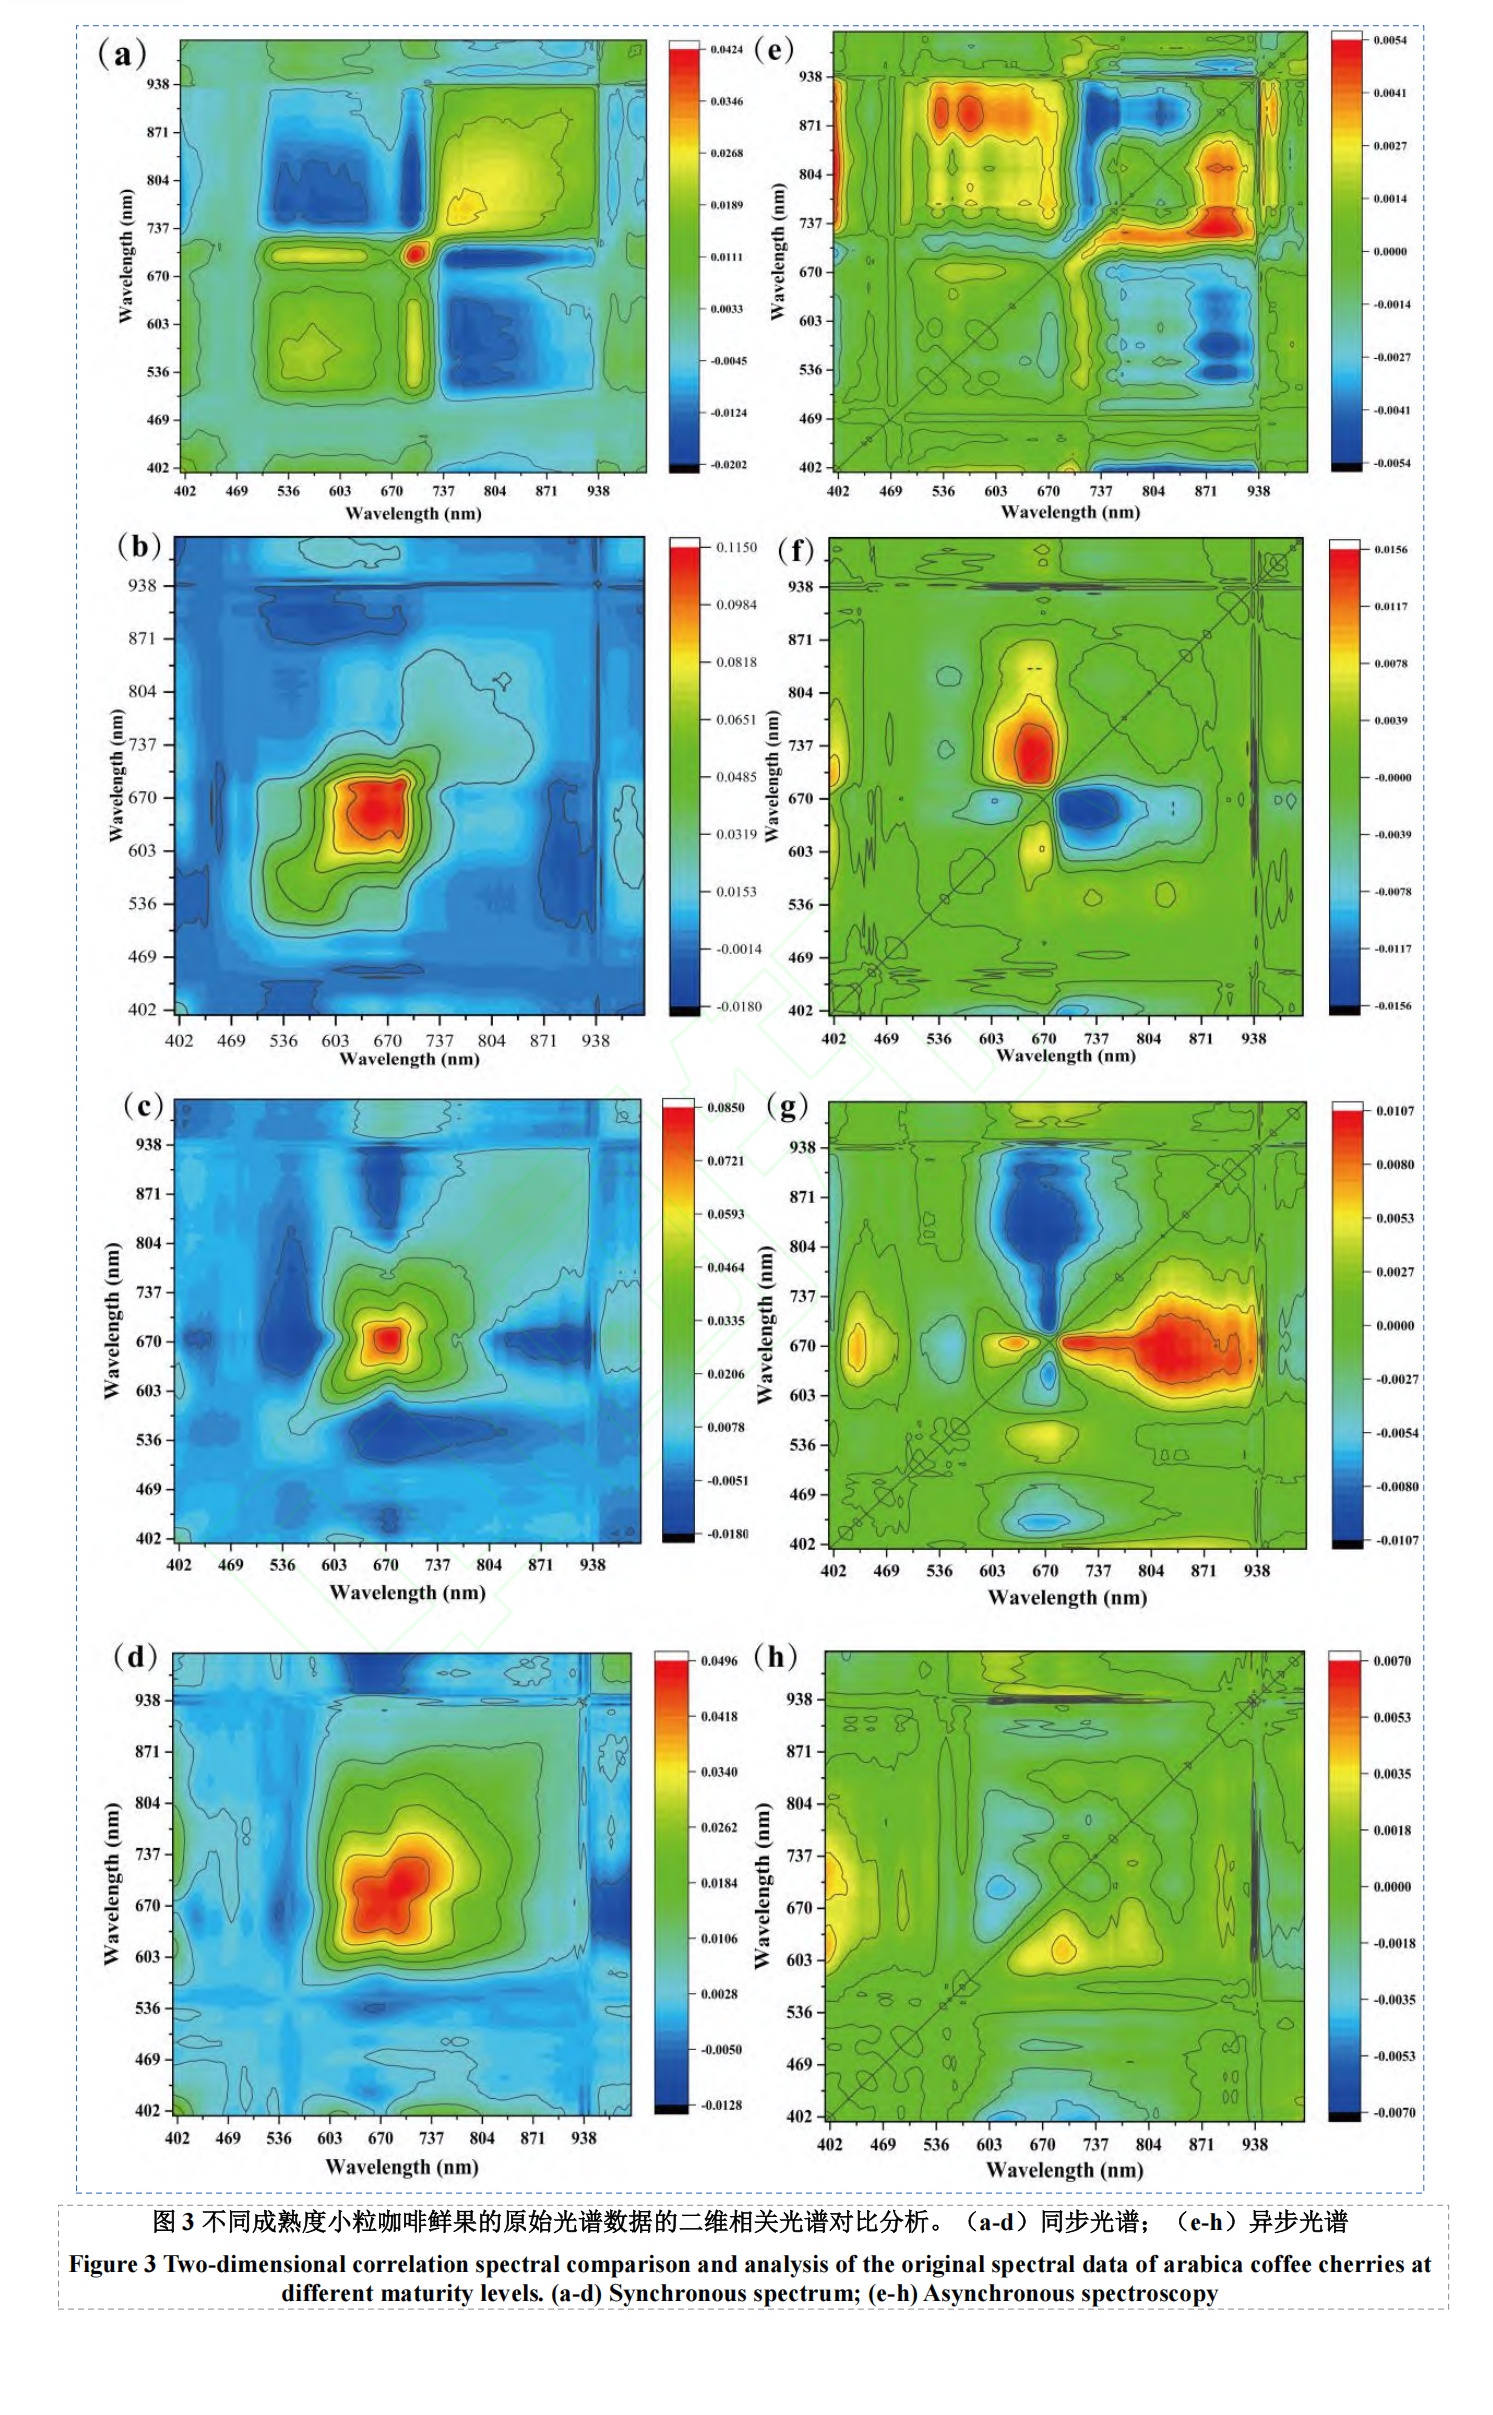
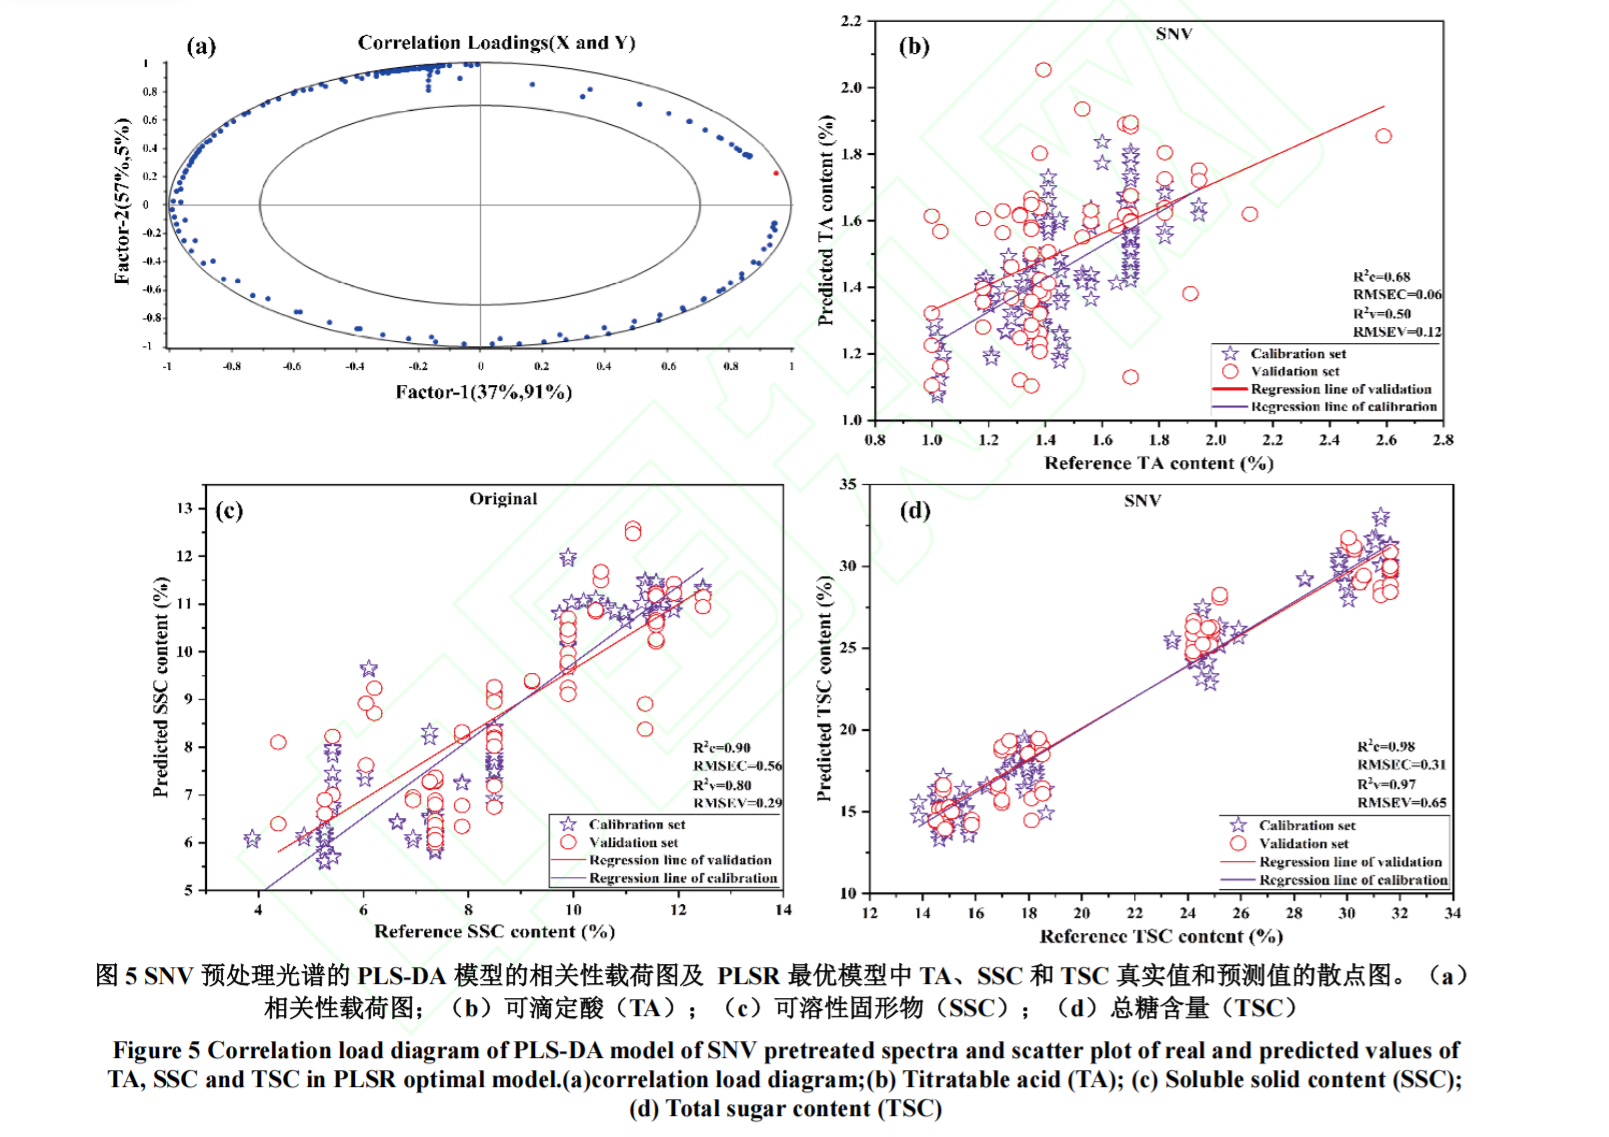
Therefore, preprocessing is necessary before building recognition models.The paper compared several methods:NormalizationSavitzky‑Golay (SG) smoothingMultiplicative Scatter Correction (MSC)First‑derivative (FD)Standard Normal Variate (SNV) The results showed that SNV effectively eliminates scattering effects caused by fruit size, surface shape, and illumination differences while preserving ripeness‑related chemical information, thus giving the highest model accuracy. 04 Building the Ripeness Recognition ModelAfter preprocessing, the spectral data are fed into a PLS‑DA (Partial Least Squares Discriminant Analysis) model for training. In simple terms:The AI first learns the spectral signatures of a large number of cherries at different maturity stages, e.g.:Stage A (immature)↓Stage B (turning)↓Stage C (ripe)↓Stage D (fully ripe) The model continuously learns the spectral patterns corresponding to each stage and eventually forms a ripeness classification model. When a new cherry enters the system, only one spectral scan is needed, and the model automatically assigns it to the correct maturity level. Experimental results:SNV + PLS‑DA modelValidation set accuracy: 95.26%Calibration set accuracy: 97.23% Compared with traditional manual judgment, this approach is not only faster but also avoids misjudgments due to human experience variation.
05 Not Only Identifying Ripeness but Also Predicting Internal Quality
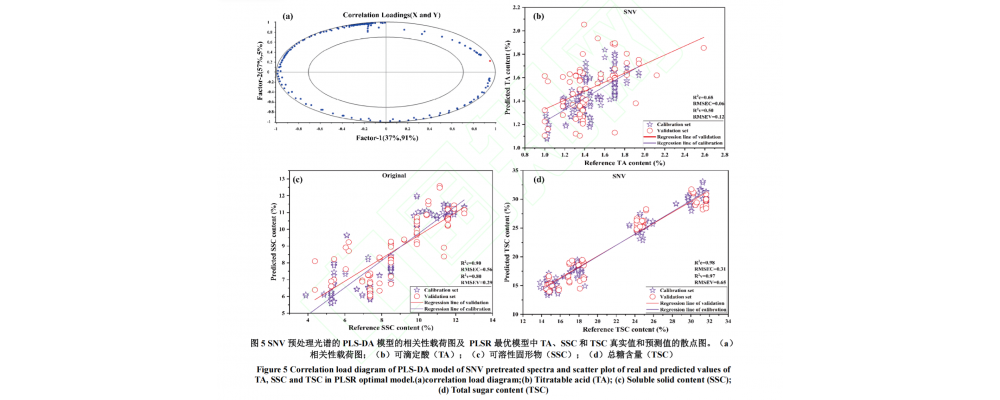
The greatest advantage of hyperspectral imaging is that it can not only "classify" but also "predict." The paper further used a PLSR (Partial Least Squares Regression) model to predict several key quality indicators, including:Soluble solids (SSC)Total sugars (TSC)Titratable acidity (TA) Among these, total sugar prediction performed best, with a validation set coefficient of determination (R²) of 0.96, indicating that hyperspectral imaging can accurately reflect the sugar content inside coffee cherries. In contrast, titratable acidity showed nonlinear fluctuations during ripening, leading to relatively lower prediction accuracy. This means that hyperspectral imaging can not only answer "Is this coffee ripe?" but also go further:Has sugar reached its optimal level?Have flavor precursors been sufficiently accumulated?Is it within the optimal harvesting window?
Truly enabling a shift from "harvesting by color" to "harvesting by quality."
06 Future Prospects
In the future, hyperspectral ripeness recognition technology can be deeply integrated with drones, sorting equipment, and intelligent harvesting robots, enabling large‑scale field inspection, ripeness heatmap generation, automatic grading, and precise picking for coffee plantations. Meanwhile, combined with deep learning algorithms and portable hyperspectral devices, it can further enhance model generalization and on‑site application efficiency, establishing a standardized, digital, and intelligent quality management system for the specialty coffee industry. This is precisely the important development direction of hyperspectral technology in modern smart agriculture. References1. Li Zelin, Wang Kunxian, Dao Jian, Shang Dapeng, Peng Jingqiu, Fan Jiangping, Gong Jiashun. Non‑destructive discrimination of fresh fruit maturity and changes of flavor precursors of Yunnan arabica coffee cherries based on hyperspectral[J]. Food Science, 2026. DOI: 10.7506/spkx1002‑6630‑20260126‑213 For more information, please contact:Email: optoskyphotonics@gmail.comWeb: www.optosky.net

-100x100.jpg)


Related Products
Notice: Undefined index: is_bestseller in /data/wwwroot/optosky/catalog/view/theme/mediacenter/template/new_elements/product.tpl on line 33 Notice: Undefined index: is_latest in /data/wwwroot/optosky/catalog/view/theme/mediacenter/template/new_elements/product.tpl on line 36

Notice: Undefined index: is_bestseller in /data/wwwroot/optosky/catalog/view/theme/mediacenter/template/new_elements/product.tpl on line 33 Notice: Undefined index: is_latest in /data/wwwroot/optosky/catalog/view/theme/mediacenter/template/new_elements/product.tpl on line 36
Search
Categories
Popular Posts


Latest Posts







Comments: 0
No comments