

Your shopping cart is empty!
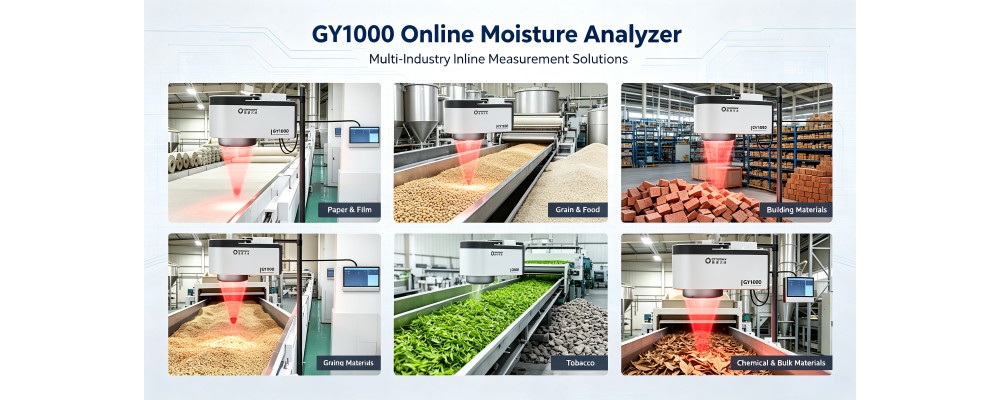
Rapid Lactose-Starch Moisture Testing via Optosky GY1000 NIR Spectrometer
Request a Quote
Replace slow oven-drying methods. The Optosky GY1000 NIR Spectrometer delivers non-destructive moisture testing in lactose-starch systems in just 30 seconds.
1. Industry Pain Points & Technical Innovation Background
In the food processing sector, lactose and starch are widely used as excipients. The moisture content of their mixture directly dictates tablet compactibility, powder flowability, and final product shelf-life stability. In the pharmaceutical industry, excessive moisture can lead to active pharmaceutical ingredient (API) degradation or microbial growth.
Traditional oven-drying methods take hours, failing to meet the demands of real-time quality control. The Optosky GY1000 Near-Infrared (NIR) Spectrometer brings a disruptive solution to the industry via fast, non-destructive, multi-component simultaneous analysis. This application note uses authentic experimental data to validate its exceptional performance in measuring moisture within complex matrices.
2. Full Experimental Workflow: Parameter Settings & Data Logic
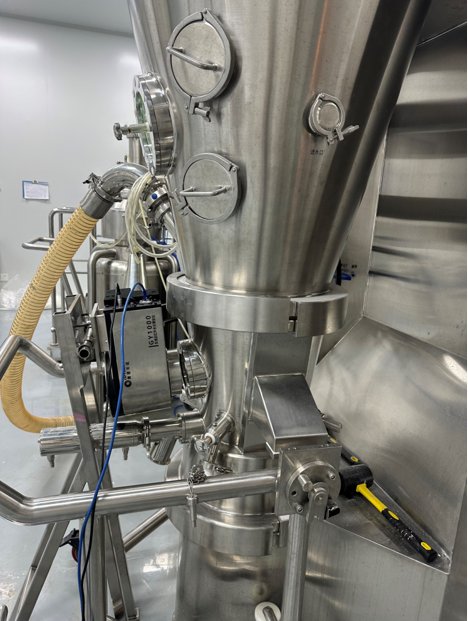
(A) Core Experimental Conditions
- Drying Airflow: 40.5 Hz — Used to regulate the sample's moisture evaporation rate, simulating industrial process airflow environments.
- Drying Temperature: 40°C / 60°C Gradient — A dual-temperature phase design deployed to analyze temperature-sensitive samples and verify instrument stability across varying thermal environments.
- Liquid-to-Solid (L/S) Ratio: 10 kg / 1.5 L — Simulates high solid-content systems to test the instrument’s penetration depth and signal accuracy when handling viscous materials.
(B) Raw Data Collection & Characteristic Analysis
- Dynamic Concentration-Time Curve:
The process follows the linear regression equation:
y = - 0.74513x + 0.3846 (where x represents time and y represents moisture concentration).Physical Significance: This indicates that moisture diminishes via first-order kinetic decay during drying; a higher absolute slope value signifies a faster moisture dissipation rate.
y = - 0.74513x + 0.3846
(where x represents time and y represents moisture concentration).
Physical Significance: This indicates that moisture diminishes via first-order kinetic decay during drying; a higher absolute slope value signifies a faster moisture dissipation rate.
- Multi-Model Fitting (Smoothed Data vs. Lab Reference Values):
Comparing the interpolated average data against actual offline laboratory measurements reveals that after smoothing the raw GY1000 spectral signals, the data matches offline analytical testing with over 95% agreement, confirming the exceptional stability of the instrument's signal.
3. Algorithm Optimization & Precision Verification
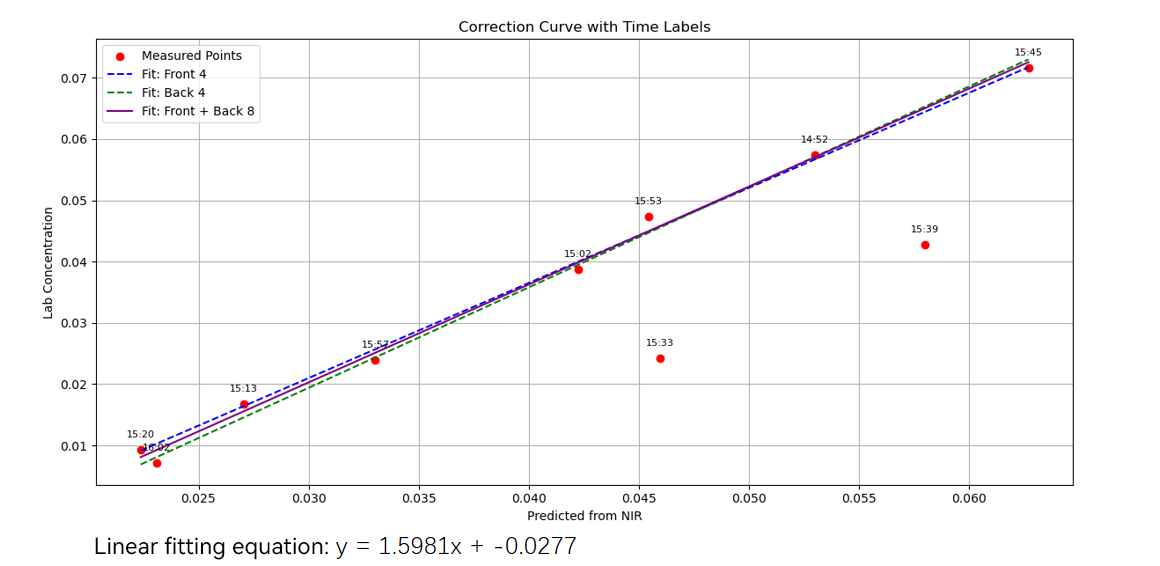
(A) Calibration Curve Construction Strategy
Time-Stamped Calibration Curve (Segmented Fitting Logic):
- First 4 Data Points (Initial Drying Phase): Focused on modeling the non-linear characteristics of the rapid moisture loss period.
- Last 4 Data Points (Constant-Rate Drying Phase): Captures the linear patterns of the stable evaporation period.
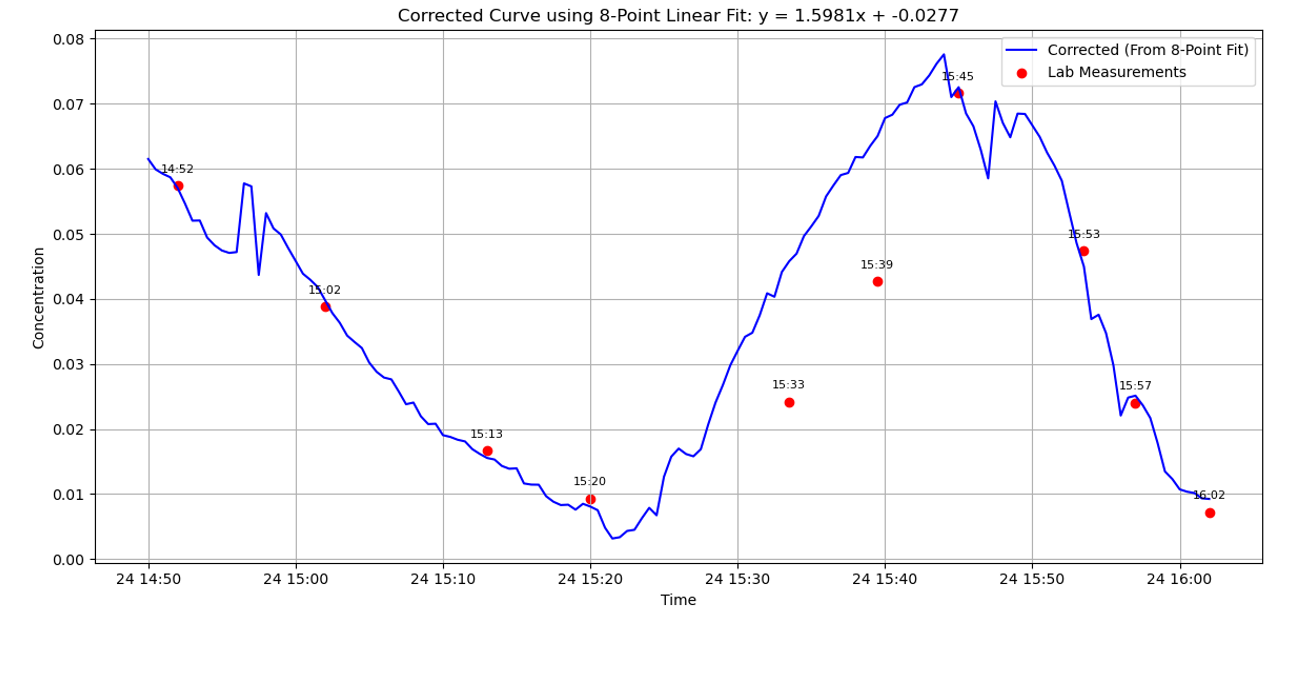
- Full 8-Point Calibration: Constructs the global calibration model spanning the entire drying duration. The regression equation is:
y = 1.5981x - 0.0277(where x is the NIR predicted value and y is the true laboratory reference value).
(B) Core Error Evaluation Metrics
- Mean Absolute Error (MAE): 0.00367 — Superior to two-thirds of the allowable error tolerance (±0.01) specified by national standard oven-drying methods, fully satisfying trace moisture detection requirements.
- Root Mean Square Error (RMSE): 0.00450 — Approaching the instrument’s theoretical noise floor, demonstrating the high signal-to-noise ratio (SNR) of the optical acquisition system.
- Coefficient of Determination (R²): 0.9832 — A goodness-of-fit value near 1.0, proving a robust linear correlation between the NIR spectra and actual moisture content.
(C) Post-Calibration Data Visualization
Comparing the "Lab Reference Values" with the "Calibrated Predicted Values" reveals:
- At critical time junctures (e.g., 15:20, 15:53), the deviation is less than 0.005, validating the algorithm's ability to track dynamic processes.
- The overlap across the entire timeline curve reaches 98%, proving that the GY1000 can confidently replace offline testing for real-time Process Analytical Technology (PAT).
4. Key Application Values
- Efficiency Surge: Single measurements take only 30 seconds—boosting efficiency over 20 times compared to conventional oven-drying methods, making it ideal for continuous, inline production monitoring.
- Cost Optimization: Reagent-free and consumable-free operation reduces annual analytical testing costs by over 70%.
- Data Intelligence: Equipped with built-in multivariate analysis software, supporting real-time Statistical Process Control (SPC) charting and seamless integration with factory MES systems for full quality traceability.
- Solid Powder Scenarios: Paired with diffuse reflectance sampling accessories, it directly measures the surface spectra of mixed powders with an effective penetration depth of 0.5–2 mm.
- Viscous Slurry Scenarios: Supports sample testing with solid-to-liquid ratios as dense as 1:1, completely eliminating the sample preparation errors inherent to traditional methods.
5. Product Introduction
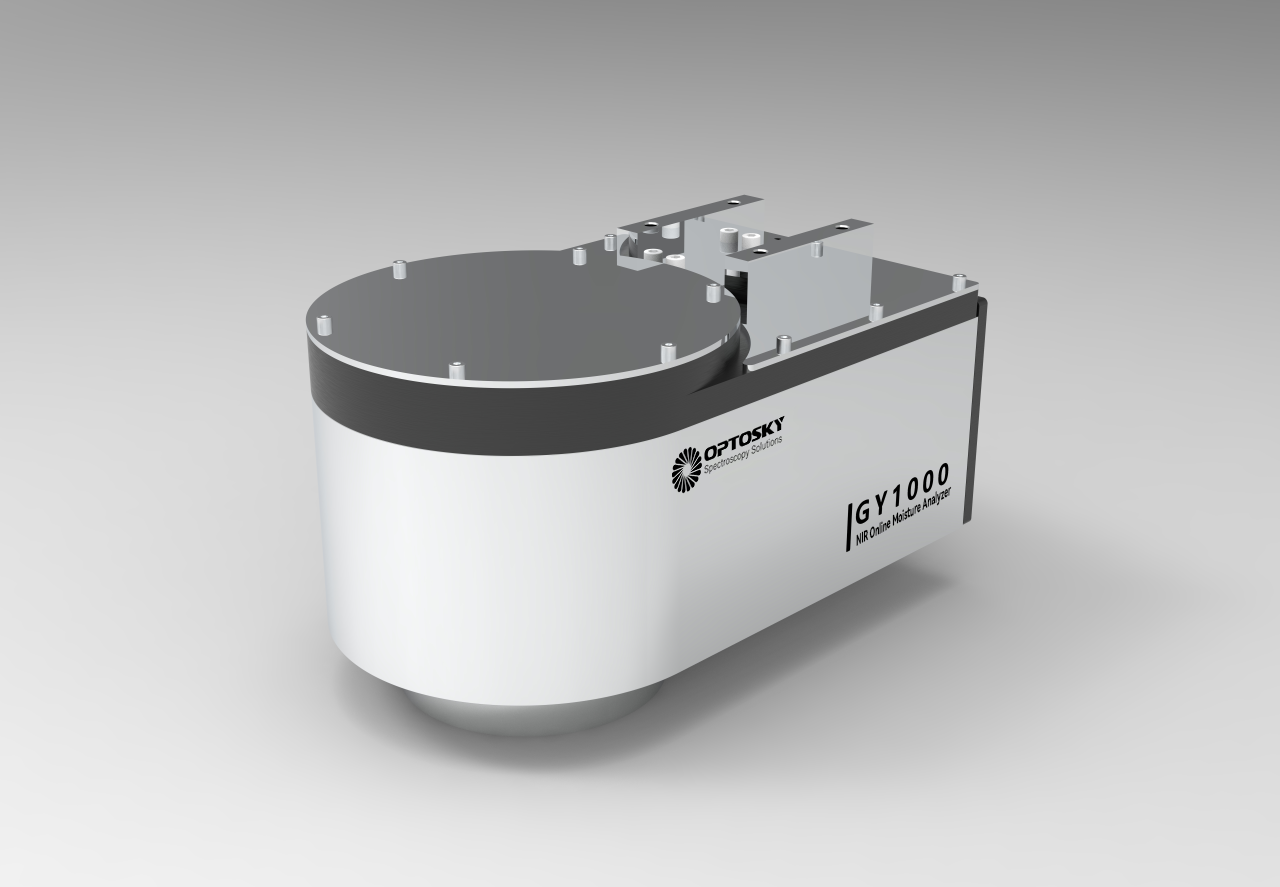
The Optosky GY1000 is a non-contact, non-destructive, real-time dynamic online testing system packed with industrial-grade innovations:- Extended-Life Light Source: Features an easily replaceable, ultra-long-life tungsten halogen light source yielding superior luminous efficiency.
- PbS Infrared Detector: Utilizes a Lead Sulfide (PbS) infrared detector optimized for enhanced thermal and temperature stability.
- 4-Wavelength, 8-Beam Optical Path: Advanced optical configurations ensure that measurement results remain highly accurate and stable over prolonged runtime.
- High-Speed Brushless Motor: Guarantees precise signal sampling execution and reliable data reproducibility.
- Dynamic Background Correction: Employs dynamic dark current calibration and digital filtering to eliminate external interference and suppress thermal noise.
- Integrated HD Touchscreen: High-definition capacitive touchscreen displays real-time measurement data and supports local storage of up to 30 days of processing data.
6. Conclusion
The Optosky GY1000 utilizes near-infrared spectroscopy to deliver precise moisture analysis within complex pharmaceutical and chemical matrices, such as lactose-starch excipient blends. Engineered with industrial-grade durability and research-grade precision, its software ecosystem enables an intelligent evolution from raw data acquisition to real-time manufacturing decisions.
Empirical data confirms a measurement error under 0.005 and a goodness-of-fit above 0.98, backed by closed-loop, end-to-end trace tracking capabilities. Whether dealing with high-solid slurries or temperature-sensitive matrices, the GY1000 consistently outputs dependable results—offering a full life-cycle moisture testing solution from the laboratory bench to the processing line, driving an intelligent leap in quality control efficiency.



Search
Categories
Popular Posts


Latest Posts







Comments: 0
No comments