Your shopping cart is empty!
Application of ATH9010 in Monitoring Rice Diseases
This study utilizes the ATH9010 hyperspectral imaging system to accurately monitor rice disease severity using UAV data and deep learning models.
Rice is one of major food crops and plays a crucial role in the survival and development of people. The growth status of rice directly affects the yield and quality of rice, making the health of rice a major concern for millions of farmers. Among the various factors impacting rice growth, diseases are the most significant disturbance. The invasion of various diseases can reduce rice yield or cause widespread lodging overnight, making early monitoring and scientific control of rice diseases essential.
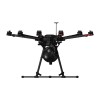
This study utilizes a UAV to acquire hyperspectral data for monitoring rice diseases through machine learning and deep convolutional neural networks.
Rice Field
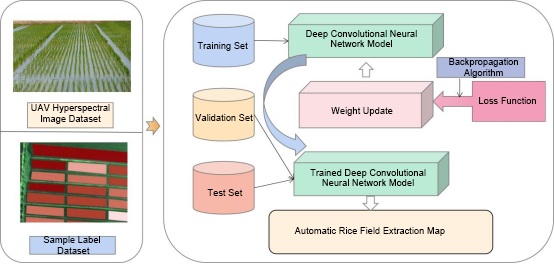
First, hyperspectral images are preprocessed. Then, deep neural networks are employed to precisely extract rice fields. Next, the spectral information and disease features of the rice are analyzed. Finally, a Probabilistic Neural Network (PNN) is used for accurate disease severity monitoring, providing valuable insights for rice management.
Flowchart
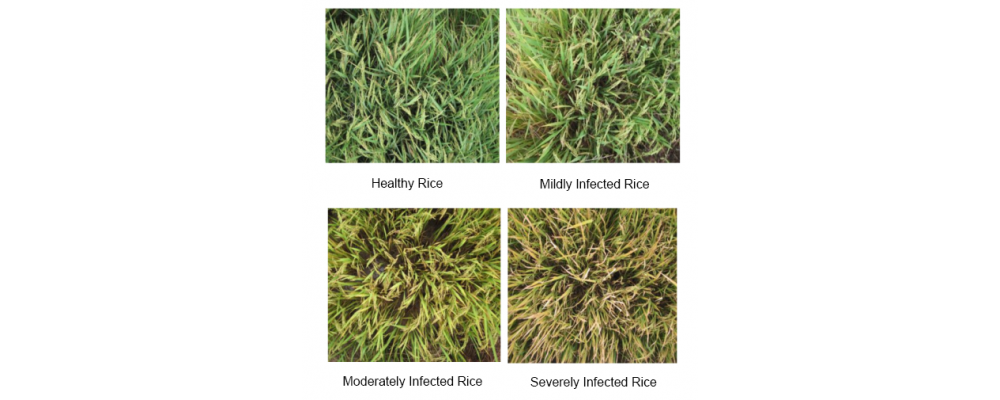
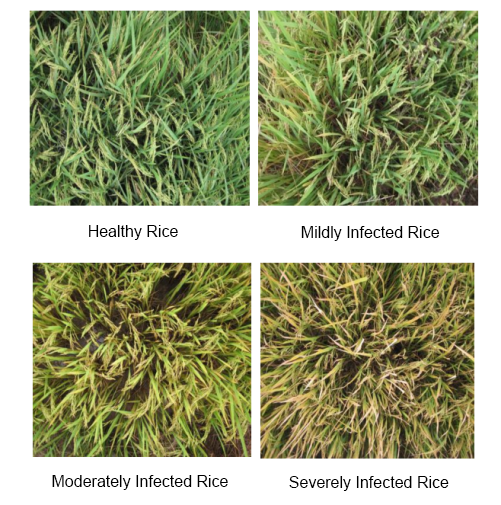
Rice disease monitoring is categorized into four levels: healthy, minor disease, moderate disease, and severe disease, based on the severity of the disease affecting the rice.
Physical Diagram of Rice Disease Levels
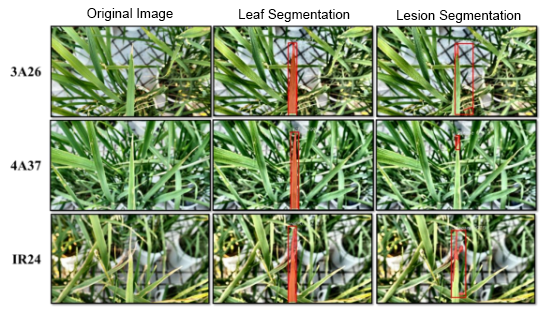
The process includes steps from the raw image to leaf segmentation and then to disease spot segmentation.
Lesion Segmentation
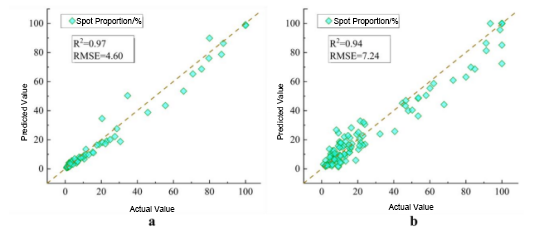
Accurate estimation of white leaf spot proportions is fundamental for assessing disease severity. Using disease severity to characterize rice bacterial leaf blight not only reduces prediction errors of spot proportions in models but also helps in developing an intelligent breeding decision mechanism by integrating disease onset times. Disease severity levels for the validation and test sets were determined based on PNN model predictions of spot proportions. The accuracy of disease severity prediction for the validation set remains higher than that for the test set, at 90.90%, with a micro F1 score of 0.90 further demonstrating the stable predictive capability of the PNN. The confusion matrix indicates that the image segmentation model tends to output results with a higher spot proportion than the actual. The accuracy for determining disease severity in the test set is 85.00%, with most misclassifications occurring in lower disease severity levels.
Predicted Lesion Ratio Results
Search
Categories
Popular Posts
Latest Posts



-100x100.jpg)


-75x75.jpg)


Comments: 0
No comments