How to use quantitative methods to rapid test proteins by using Ultra-micro spectrophotometer?
Ultra-micro spectrophotometer itself is a very important type of analytical instrument, whether it is in scientific research fields such as physics, chemistry, biology, medicine, materials science, and environmental science, or in modern products such as chemical engineering, medicine, environmental testing, and metallurgy. It has very important applications with management departments.
Ultra-micro Spectrophotometer:
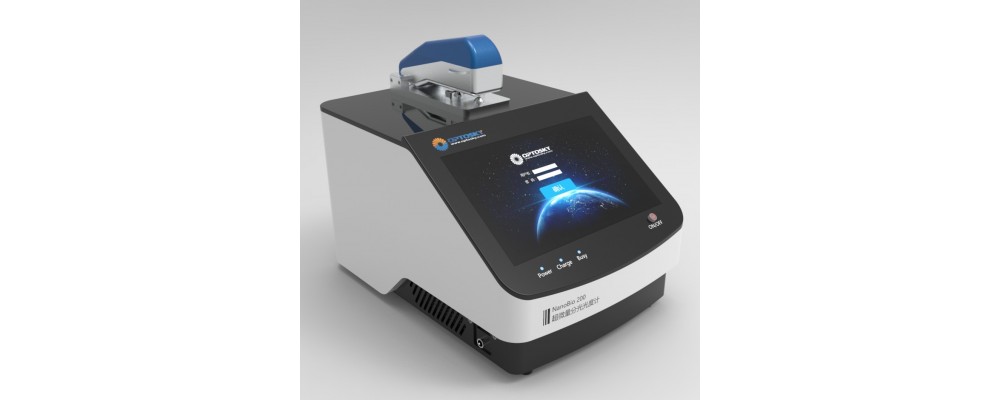
Based on more than 20 years of experience in the development of spectral instruments, the full-wavelength (190~1000 nm) ultramicro spectrophotometer of Auspectrometer, NanoBio 200, is capable of fast and accurate detection of nucleic acids and proteins by using the self-produced high-performance optical fiber spectrometer and the high-stability pulse xenon lamp produced by Hamamatsu Company in Japan.
At the same time, it also has the advantages of convenient use, less consumption of samples (only 0.5~2l), no preheating, rapid cleaning of residual samples, no need for a colorimetric dish or other sample positioning device, no need for dilution of samples, etc.
Protein quantitative method:
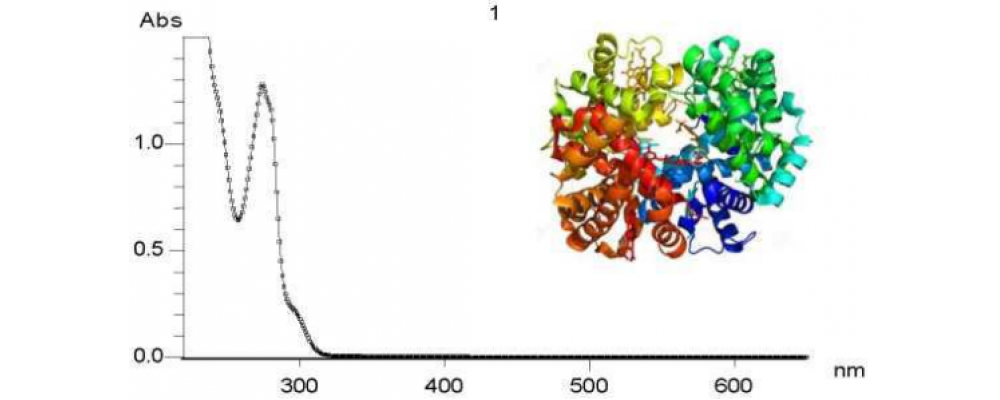
Tyrosine, phenylalanine and tryptophan have the maximum absorption at 280nm, and the contents of these three amino acids of various proteins are not different, so the absorbance value of protein solution at 280nm is the most commonly used protein
The intensity of light absorption of protein solution at 238nm is directly proportional to the number of peptide bonds.
Therefore, a standard curve can be drawn by using A238 as the vertical coordinate and A238 as the horizontal coordinate in the preparation of standard protein solution.
This method is more sensitive than the 280nm absorption method.
But a variety of organic compounds, such as alcohol, ketone, aldehyde, ether, organic acid, amide and peroxide have interference.
For protein solutions containing nucleic acids, A280 and A260 can be determined, respectively. The empirical formula is as follows: protein concentration = 1.45xA280-0.74xA260 (mg/ mL)
For non-pure proteins, the standard curve method such as BCA, Bradford and Lowry was used.
The testing process is very simple:
1. Sample ordering: Lift the measuring cover, draw 1 to 2 L from the sample with a pipette, and drop it onto the droplet holder
2. Form a measuring liquid column: Close the measuring cover gently to form a measuring liquid column.
3. Start measurement: Select the measurement items to be carried out from the touch screen and carry out corresponding tests within 3s, the corresponding results can be obtained.
4. Wipe the sample table: lift the measuring table and wipe the residual liquid on the droplet base with mirror wiping paper. Pay attention to wipe the upper and lower droplet bases.
Protein:
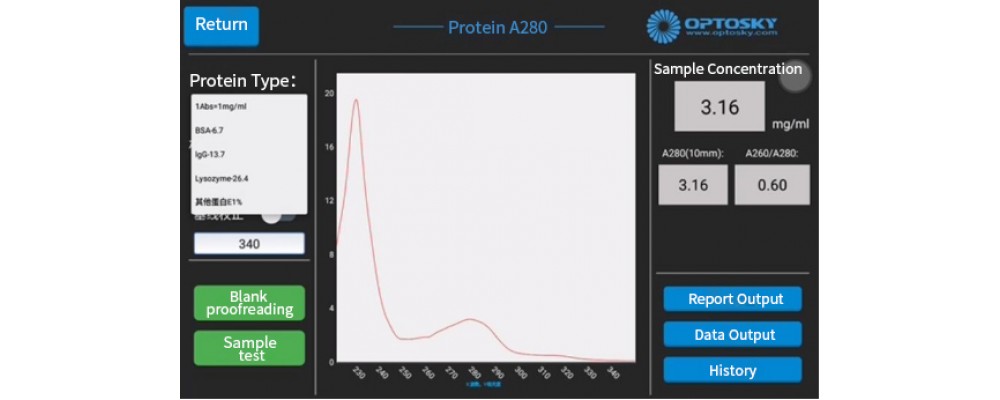
A280 method: A280 measures the concentration of protein samples, including 1Abs=1mg/mL, BSA, IgG, and Lysozyme.
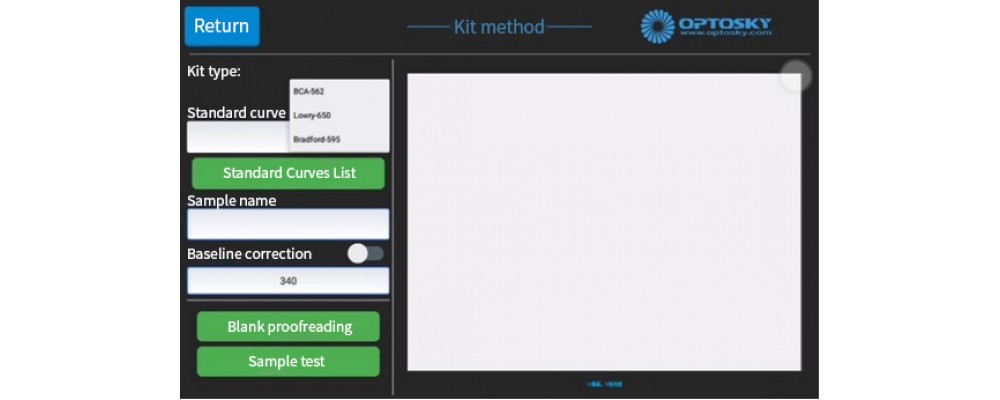
Kit method: The kit method (Lowry method, BCA method, Bradford method) determines protein concentration, the software automatically draws a standard curve, and directly gives the concentration value.
Protein has a maximum absorption peak around 280nm ultraviolet.
The difference and advantages of Optosky ultra-micro spectrophotometer and traditional spectrophotometer:
The required sample volume is small, only 0.5~2μ;
No cuvette is needed. Use a pipette to drop the sample directly onto the detection platform. The sample will automatically form a liquid column during measurement;
Just wipe the sample from the testing platform with clean absorbent paper;
Multiple fixed optical paths (optional): 1, 0.25 and 0.05mm;
The sample does not need to be diluted, and the measurement range can reach 50 times that of a conventional spectrophotometer;
The light source is a pulsed xenon lamp with a life span of up to 10 years and stable performance;
No need to preheat, can be tested at any time;
The absorbance value is displayed at the same time, while the concentration value is directly given;
Small size (29×21×22 cm3) and lightweight (3.0 kg).



Comments: 0
No comments