
Your shopping cart is empty!
-1000x400.png)
What is the new choise for Raman characterization of carbon materials?
Carbon is the most abundant element in the nature. It has low cost, long life, high temperature resistance, diverse stuctures, and high specific capacitance of carbon materials. It is currently the most active research direction in the field of electrochemistry. It is also the one of the inportant topics in the development of clean & renewable energy, and play a vital role in electeic cars, mobile communications, solar and wind power, aerospace and defense technology, etc.
The research of carbon nanotechnology is quite active in recent years. Common carbon materials is graphene, graphite, carbon nanotubes and carbon black, etc. They all show the unique electrical conductivity, thermal conductivity and mechanical strength. It's all due to the unique structure of each allogtaft. However, how to describe the types and quality of different carbon nanomaterials in a simple quite way to effectively monitor, control production and later application is an inportant issue. Because of the molecular vibration characteristics of nanomaterials, Raman spectroscopy has been widely used in the research field of carbon nanomatericals. It is a fast, simple, and ideal analysis tool for characterizing carbon materials.
Raman spectroscopy of carbon materials
The raman peaks of carbon materials has three principal characters: G, D and 2D (G' ). These nanomaterials has simple spectroscopy, but the auality and microstructure information is very rich. This information is revealed by the peak position, peak shape, and peak intensity. The position of the G peak near 1582 cm-1 represents the sp2 vibration mode of the graphene plane, this is a sign of the crystallinity of the material. The dispersion of G peaks can be observed in disordered graphene materials, and the dispersion of G peaks is proportional to the degree of disorder. The D peak around 1350 cm-1 is attributed to the structural disorder near the edge of the microcrystalline structure, thereby reducing the symmetry of the structure. The Raman peak intensity ratio of these two bands, ID / IG can be used to describe the degree of disorder of the material. According to the laser excitation wavelength, the position of the G 'peak is about 2700 cm-1, which is related to the number of graphene layers.
Experiment procedure:
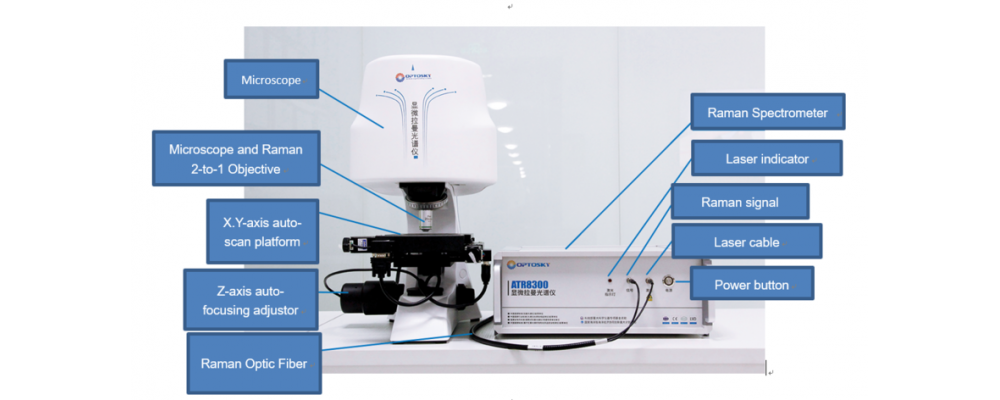
Experimental equipment: This experiment uses OPTOSKY's high-performance, high-sensitivity refrigerated micro-Raman spectrometer ATR8300-532, excitation wavelength: 532 nm, and a Raman probe holder with fine and coarse adjustment in the xyz direction. ATR8300-532 is a deep-cooled Raman spectrometer integrated with innovative intelligent spectroscopy technology. The cooling temperature reaches -10 ° C, with ultra-high sensitivity, ultra-high signal-to-noise ratio and wider dynamic range.
Experimental samples: single-layer graphene, carbon nanotubes, single-crystal graphite, and carbon black powder.
Result & discussion:
Graphene has obvious G peak and no D peak, which reveals its high order and crystallinity. The sharp, symmetrical single G 'peak reveals its perfect single Lorentz peak shape. The graphite spectrum has obvious G peaks and no D peaks, which reveals its high order and crystallinity. Since graphite is composed of many layers of single-layer graphene, the G 'peak observed in the graphite spectrum is more extensive and asymmetric than the graphene G' peak, which illustrates the multiple components of multiple phonon modes. Carbon nanotubes show the unique characteristics of the G peak. Due to the constraints and curvature of the graphene layer when forming nanotubes, the G peak is asymmetric on the MWNT, and it is more likely to split into two bands, G + and G- peaks. The Raman spectrum of carbon black has the lowest crystallinity, shows a large D peak and a wide G peak, and has a high ID / IG ratio, indicating a disordered structure.
End:
Traditional confocal micro Raman spectrometers have high requirements on the environment due to their high cost, large volume, and complicated operation. They are very inconvenient for monitoring and daily Raman characterization of carbon materials in large-scale carbon material manufacturing environments. In this case, we need simpler, faster and more cost-effective analysis tools. By using OPTOSKY's ATR8300-532, a high-performance, high-sensitivity, refrigerated micro-Raman spectrometer to characterize four carbon nanomaterials, it has been shown that Orbital's micro-Raman spectrometer can simply, quickly and effectively provide rich Information on the properties of olefins, carbon nanotubes, graphite and carbon black, and other carbon nanomaterials can be an ideal tool for online or offline characterization of carbon nanomaterials, product quality control and process monitoring.
Search
Categories
Popular Posts


Latest Posts


Comments: 0
No comments