
Your shopping cart is empty!
How can the Raman Microscope Software Combine technology of Mapping and Image Splicing?
Optosky has updated the most advanced Raman microscope software. It's known that Raman microscope has been used in many fields, such as the pharmaceutical industry, nanoparticles, and new materials, science research Institutions, bioscience, Forensic identification, material science, medical immunology analysis, agriculture, and food safety, gemstones & minerals identification and so on. Optosky Raman microscope combines the benefits of microscope and Raman spectrometer base on triple bands wavelengths of 1064nm, 830nm,785nm,532nm,633nm..It becomes possible to look at micro areas of samples on the computer screen with just a single mouse click, then splice these scan images to a vivid picture. You never imagine such powerful software realize in Raman microscope before, and Optosky is ready to offer to customers now.
Spectral Information Acquisition:
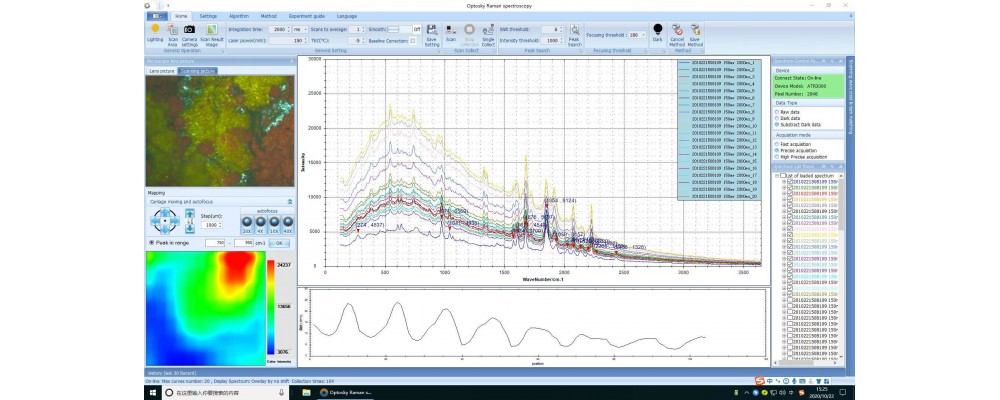
One of the main functions of the software is spectral information acquisition. Spectral information acquisition is the basis of testing. Through the acquisition, we get the spectrum to analyze the samples. One of the software's advantages is it will overlap the spectrum on the software, you can contrast them on the screen in order to get more accurate information.
Mapping:
the second function is MAPPING with its purpose is to measure the content distribution of the target substance in the selected area of the sample. Follow-up the similar steps as spectral data collection. But pay attention to selecting the scanning area through dragging the left mouse button to set x & y step length, the final measure result is X*Y.
It is worth mentioning that Mapping can divide the selective area into "small blocks" according to the selective area and the "step length" of x and y.
Then perform the scan a time in the middle point of the small blocks, and the collected spectral image forms color blocks reflecting the intensity and concentration, and finally, these color blocks are put together to form the mapping image seen.
Image Splicing:
The function can splice the spectral images to form a whole image. It splices up the small field of view and finally sees the big field of view completed in the bottom left corner on window screen. It is not limited to the focal point of the microscope and has a more direct representation of the total sample contents distribution.
X-axis Set:
The unit of wavelength curve's X axis can choose wave numbers and pixels.
Wavelength Curve Number:
It can control the quantity of wavelength curve showing. Can be a customer set and comparative analysis.
Spectrum List:
It can clearly display the sequence number of the corresponding curves, which can facilitate customers to find the desired curve. The curve can be shown or hidden by checking it.
History:
This feature allows you to see historically examined data and avoid missing data due to improper storage.
Algorithm Lists:
This software contains a variety of algorithms, the basic algorithm operation, derivative, normalization, baseline calibration, restore, and other functions. operation and baseline calibration can optimize the curve, enabling customers to get a better spectrum curve used for publication or paper writing. Derivation and normalization are the basic requirements of researchers.
Multi-spectrum functions :
Multispectral functions include original translation, XY translation, Y-axis translation, and Y-peak translation.
Spectral Calculation:
Spectral operations include constant operations and spectral operations.
Methods Save:
The new method storage function is added to the software, which can improve the efficiency of staff and enable them to spend more energy on their work.
If you are interested in it, do not hesitate to contact us for more information.
Search
Categories
Popular Posts


Latest Posts


Comments: 0
No comments