Using Field Spectroradiometer to Identify Rice Chlorophyll Concentration
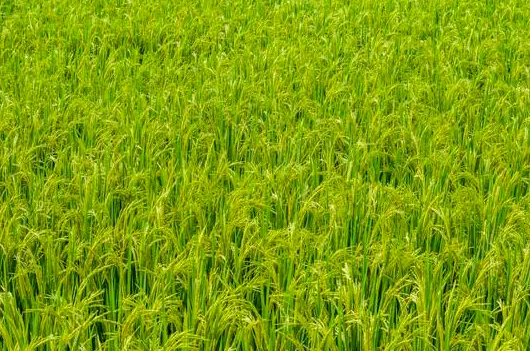
This article investigates using a Field Spectroradiometer to identify chlorophyll concentration in rice leaves. The study highlights the effectiveness of hyperspectral technology for assessing chlorophyll levels in rice leaves using field-based spectral data.
Chlorophyll concentration is a key indicator of plant nutritional stress, photosynthetic capacity, and developmental aging stages. The use of Field Spectrometry and remote sensing technology to detect chlorophyll concentration has gained significant attention in agriculture and natural plant community studies. Most research focuses on the relationship between spectral reflectance and chlorophyll a or total chlorophyll concentration, while some investigate chlorophyll b or the ratio of chlorophyll a to chlorophyll b concentrations. Other studies primarily target carotenoid concentration or the ratio of carotenoids to chlorophyll.
Numerous studies indicate that the vegetation spectral "red edge" is sensitive to plant growth conditions. The red edge inflection point, where the slope of the reflectance spectrum is steepest, occurs between wavelengths of 690-720 nm. Laboratory experiments have confirmed a positive correlation between the wavelength position of the red edge inflection point and the chlorophyll concentration in leaf samples.
This study examines the reflectance of rice leaves at different chlorophyll concentrations and measures the red edge through the first derivative of the reflectance curve. It further investigates the correlation between rice leaf reflectance and chlorophyll concentration, as well as the relationship between the spectral red edge wavelength position of rice leaves and their chlorophyll concentration.
Principle:
.png)
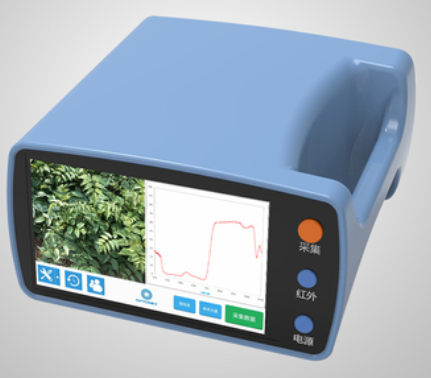
The Field Spectrometer is a crucial scientific instrument used for measuring and collecting spectral data of terrestrial materials. It can measure physical quantities such as brightness, illuminance, reflectance, and spectral distribution. The Field Spectrometer integrates data measurement, collection, storage, and processing, making it an essential tool for capturing spectral data and extracting spectral feature information.
In terms of technical characteristics and applications, the Field Spectrometer features high sensitivity and high resolution, equipped with a fixed holographic grating and a full-array optical detector. This configuration minimizes the potential for calibration failure that can occur with built-in fiber optics, narrow slits, and moving gratings or prisms.
Moreover, the applications of the Field Spectrometer are extensive, including mineral identification and resource estimation in mineral exploration, as well as land classification and disaster monitoring in remote sensing applications. For instance, in mineral exploration, different minerals exhibit unique spectral characteristics that can be identified through spectral analysis, revealing mineral types and distributions. In remote sensing, land classification is conducted using spectrometers mounted on satellites or UAVs, enabling the classification and monitoring of surfaces such as forests, agricultural fields, and urban areas. Disaster monitoring uses spectral analysis to quickly assess the extent and severity of natural disasters.
Data Processing and Analysis
Reflective Spectral Characteristics of Rice Leaves
Figure 1 shows the spectral reflectance of rice leaves across nine regions, illustrating typical plant spectral characteristics. The spectral reflectance displays two low reflectance zones between 400–500 nm and 600–700 nm, where blue and red light radiation is fully absorbed by chlorophyll for photosynthesis, resulting in a reflectance ratio generally below 10%. Beyond 500 nm, leaf absorption decreases, reaching a minimum around 550 nm in the green band, where a small reflectance peak of approximately 20% is formed—this is why plant leaves appear green.
At 700 nm, the reflectance suddenly increases, transitioning into the near-infrared range, where the curve stabilizes into a high reflectance plateau, typically reaching 50–60% or even higher. This change from the low point of chlorophyll's red absorption zone to the higher reflectance region due to leaf scattering is known as the "red edge," generally located between 690–720 nm. The "red edge" is crucial in the first derivative of the reflectance curve, with some researchers confirming the relationship between leaf red edge and chlorophyll concentration. The inflection point of the "red edge" represents the steepest slope in the plant's reflectance spectral curve, indicating the fastest change in reflectance.
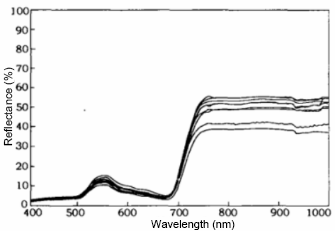
Figure1: Reflective Spectral Characteristics of Rice Leaves
2.1.2. Single Band Correlation Analysis
A single correlation analysis was conducted between the spectral reflectance at various wavelengths of rice leaves with different nitrogen application levels (9 samples) and their chlorophyll concentrations. Figure 2 illustrates the correlation coefficients between the two variables. As shown in Figure 2:
1.From 420 nm to 720 nm, a negative correlation is observed. As the wavelength increases, the negative correlation coefficient sharply rises, reaching -0.6 at 460 nm, -0.8 at 560 nm, and peaking at -0.95 near 686 nm.
2.From 686 nm to 726 nm, the correlation abruptly transitions from the maximum negative value to zero, then continues to increase, reaching a maximum positive correlation of approximately 0.92 at 745 nm.
3.From 726 nm to 1000 nm, the correlation coefficient maintains a strong positive relationship, generally around 0.9, except for a slight decrease near 940 nm.
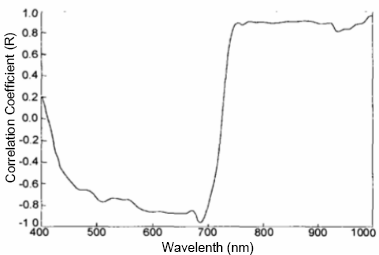
Figure 2: Correlation Coefficient of Rice Leaf Reflectance and Chlorophyll Concentration as a Function of Wavelength
The aforementioned changes in correlation are primarily due to the significant influence of chlorophyll on plant reflectance spectra in the visible light range. As the chlorophyll content increases during the growth of rice leaves, the number of intercellular air spaces increases, leading to a decrease in visible light reflectance and an increase in near-infrared reflectance. This results in a strong negative correlation in the visible light range and a strong positive correlation in the near-infrared range. Between 686 nm and 745 nm, the correlation transitions from maximum negative to maximum positive, reaching near zero at 726 nm. This is mainly because chlorophyll has the most substantial effect on the visible spectrum reflectance, while the structure of rice leaves significantly influences the near-infrared spectrum, resulting in minimal correlation at the boundary.
2.1.3. Correlation Between the Wavelength Position of the Red Edge Inflection Point in Rice Leaves and Their Chlorophyll Concentration
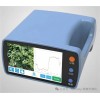
The ATP9100F handheld field spectroradiometer collects discrete data, allowing for the approximation of first-order derivatives of spectral data using Equation (1):
(1)
Where R′(λi) is the first derivative reflectance spectrum at wavelength λi, and λi+1,λi,λi−1 are the adjacent wavelengths.
Using Equation (1), the first derivatives of the reflectance spectra of rice leaves with different chlorophyll concentrations from nine regions were calculated to obtain the wavelength positions of the red edge inflection points (see Table 1).

Table 1: Wavelength Positions of Reflective Red Edge Inflection Points of Leaf Samples from Nine Regions and Corresponding Chlorophyll Concentrations
A linear regression analysis was conducted with chlorophyll concentration as the independent variable x and the wavelength position of the red edge inflection point of rice leaves as the dependent variable y (as shown in Figure 3). The linear regression equation is as follows:
(2)
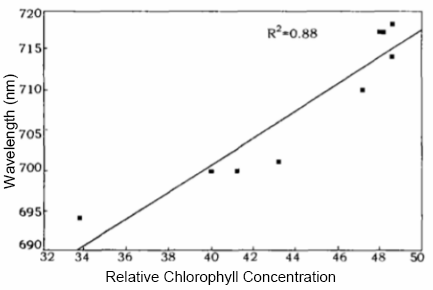
Figure 3: Correlation Between Chlorophyll Concentration of Rice Leaves and Reflective Red Edge Position
As shown in Figure 3, there is a strong correlation between the reflective red edge inflection point of rice leaves and chlorophyll concentration, with a coefficient of determination (R²) reaching 0.88. This aligns with the established theory that the wavelength position of the red edge inflection point is positively correlated with the chlorophyll concentration of leaf samples, as confirmed by laboratory experiments. Therefore, it demonstrates the feasibility of using data from a field spectroradiometer to quantitatively estimate and analyze the chlorophyll concentration in rice leaves.
Conclusion:
In this experiment, based on the analysis of the reflective spectral characteristics of rice leaves, we studied and analyzed the correlation between their spectral reflectance, the position of the reflective red edge, and the chlorophyll concentration of the leaves. The research findings indicate:
1.The correlation between the reflectance of rice leaves and chlorophyll concentration is closely related to the wavelength spectrum. A negative correlation exists between 420 nm and 726 nm, while a positive correlation is observed between 726 nm and 1000 nm. The highest correlation coefficient, greater than 0.95, is found between 450 nm and 686 nm, peaking at 686 nm. Conversely, at 726 nm, the correlation coefficient is 0. This experiment demonstrates the detectability of chlorophyll concentration in rice using field hyperspectral technology and the necessity of optimal band selection.
2.There is a strong linear correlation between the chlorophyll content of rice leaves and the position of the reflective red edge in their spectra, providing a technical method and pathway for the quantitative estimation of chlorophyll concentration in rice leaves using hyperspectral analysis.



-75x75.jpg)


Comments: 0
No comments