
Your shopping cart is empty!
Applications | Precise Color Detection of Tea Leaves Using Spectrometers
This application utilizes fiber optic spectrometers to objectively quantify tea leaf color, replacing error-prone visual inspection. By measuring spectral reflectance and applying CIE colorimetry, the system achieves 1% repeatability, enabling precise grading, online sorting, and process optimization (e.g., fixation monitoring). This drives standardization and efficiency in tea production.
Tea is a globally significant agricultural product, and its surface color is a key indicator for assessing quality. From the vibrant emerald green of Longjing to the deep, glossy brown of Pu-erh, the hue not only reflects the processing technique but is also closely related to the retention of internal compounds such as chlorophyll and tea polyphenols. Traditionally, the industry relied on manual visual assessment for color grading. This subjective method, influenced by individual experience and lighting conditions, suffers from high error rates, low efficiency, and difficulty in standardization.
Experimental evidence shows that tea color measurement technology based on fiber optic spectrometers, which utilizes CIE color system quantification, automated spectral acquisition, and precise data processing, achieves a repeatability precision of 1%. This effectively differentiates tea varieties and grades.
01 Technical Limitations of Traditional Tea Color Assessment
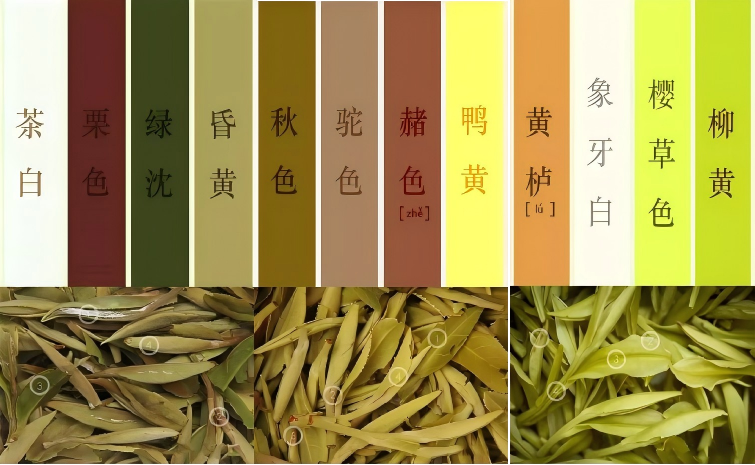 The surface color of tea leaves is a crucial quality indicator. The traditional visual method, which involves human comparison with standard color charts under specific lighting, has significant drawbacks: the human eye struggles to detect subtle color differences, results vary greatly between observers, and the process is cumbersome and inefficient. Studies indicate that the measurement error for tea color using the visual method exceeds 15%, far from meeting the needs of modern, precise grading.
02 Technical Principle and Advantages
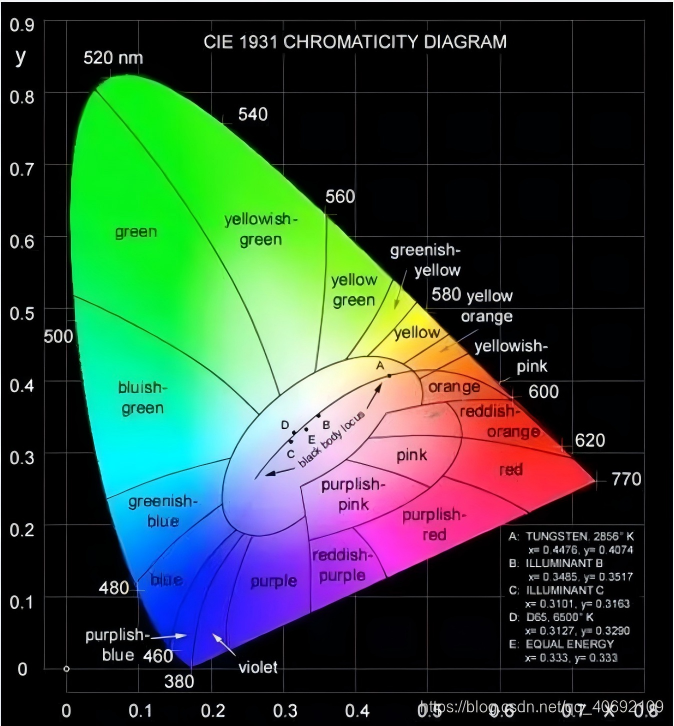
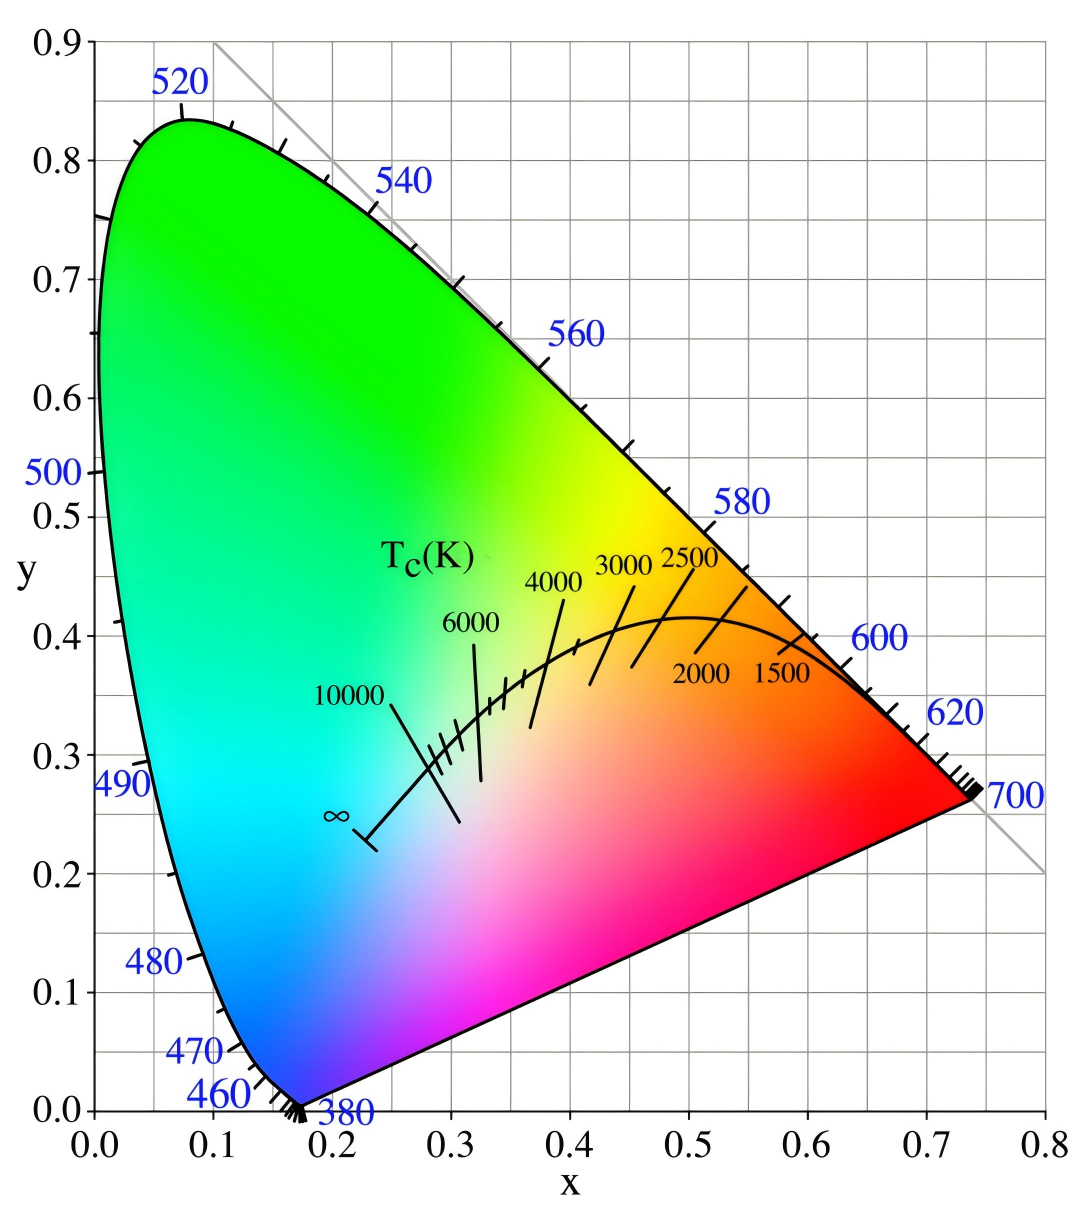 Scientific Quantification Based on the CIE Color System
The CIE color system uses tristimulus values to describe color quantitatively.
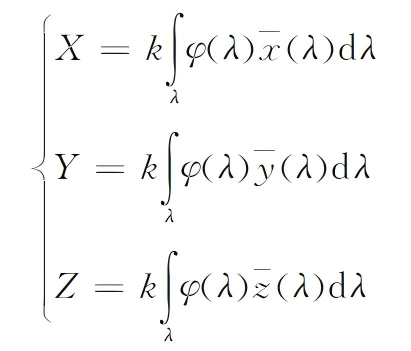 According to the CIE tristimulus value calculation model, by measuring the spectral reflectance of the tea leaf surface, color information is converted into quantifiable X, Y, Z values in the formula above.
l X, Y, Z Tristimulus Values: Correspond to the degree of stimulation of the red, green, and blue components, respectively. They are calculated by integrating the spectral reflectance ρ(λ) with the spectral power distribution S(λ) of the illuminant.
l Standard White Board Calibration: Using a standard white reference board with a known reflectance, the absolute reflectance ρ₂(λ) of the tea surface is calibrated using the formula ρ₂(λ)=φ₂(λ)×ρ₁(λ)/φ₁(λ), ensuring data accuracy.
Hardware System and Acquisition Setup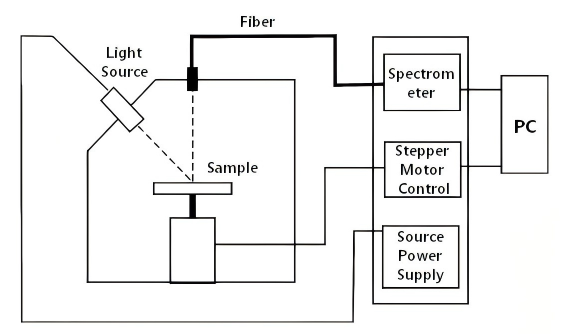 1. Light Source and Optical Path Design: A halogen-tungsten lamp serves as the illumination source, irradiating the sample at a 45° angle. A fiber optic probe with a 10mm diameter collects reflected light directly above, minimizing ambient light interference.
2. Automated Sampling System: A stepper motor controls the rotation of the sample holder. A single measurement allows for multiple samplings (5 repeats) over a 360° range. Averages are calculated via custom software to reduce random error.
3. Core Spectrometer Parameters: Utilizes a 2048-pixel linear CCD array detector, covering the visible spectrum with resolution suitable for color feature analysis.
03 Experimental Validation and Data Support
Spectral Feature Differences Among Various Teas
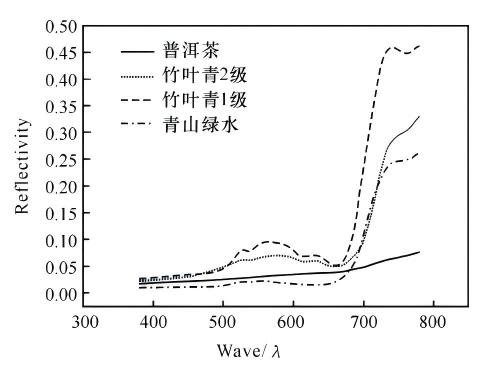
The figure above shows the reflectance spectral curves for four types of tea: Zhu Ye Qing Grade 1, Zhu Ye Qing Grade 2, Qing Shan Lv Shui, and Pu-erh. The spectral analysis is as follows:
1. Green Tea Characteristics: Zhu Ye Qing shows a distinct green light reflectance peak near 550 nm. Grade 1 tea has a higher peak reflectance than Grade 2, corresponding to a fresher, more tender appearance.
2. Pu-erh Characteristics: Reflectance is below 20% across the entire spectrum, with a flat curve consistent with its dark brown appearance.
3. Color Quantification Data: Calculations of tristimulus values allow precise distinction between teas with similar colors. For example, the X-value difference between Zhu Ye Qing Grade 1 and Grade 2 reaches 8.7%.
Repeatability and Stability Verification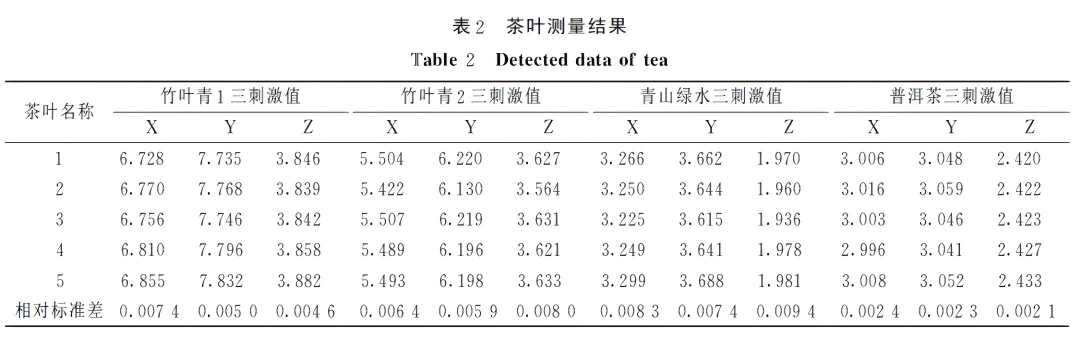 1. Short-term Repeatability: Five consecutive measurements of the same sample yielded a relative standard deviation of tristimulus values of about 1%, far lower than the error of the visual method.
2. Long-term Stability: Fluctuations in the light source voltage within a 0.5% range caused negligible changes in tristimulus values. It is recommended to allow the power supply to stabilize for 30 minutes before measurement.
3. Surface Texture Influence: The roughness of the tea leaf surface is the primary source of error, which can be effectively minimized through multiple sampling.
04 Industrial Application Scenarios and Value
Tea Grading and Quality Control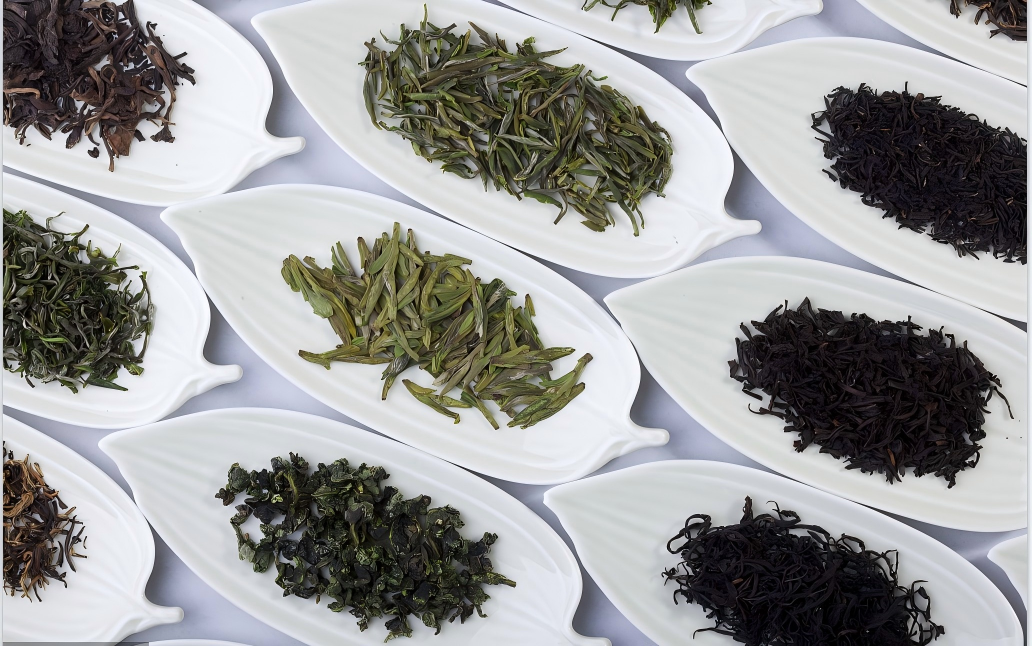 Online Production Line Inspection: By integrating the spectrometer, a conveyor system can achieve real-time scanning of over 30 tea leaves per second, enabling automatic grading based on color data. Efficiency is increased by more than 10 times compared to manual methods.
Support for Precise Pricing: Improved accuracy in color grading for premium teas can effectively help tea enterprises increase their premium rate and economic benefits.
Optimization of Processing
Fixation Process Monitoring: Real-time judgment of the fixation degree by monitoring reflectance changes at 480 nm, preventing under- or over-fixation.
Rolling Degree Assessment: The degree of chlorophyll degradation correlates positively with absorption peak intensity at 650 nm, guiding rolling time control and potentially increasing the yield of high-quality tea by 9%.
Diversified Application Expansion
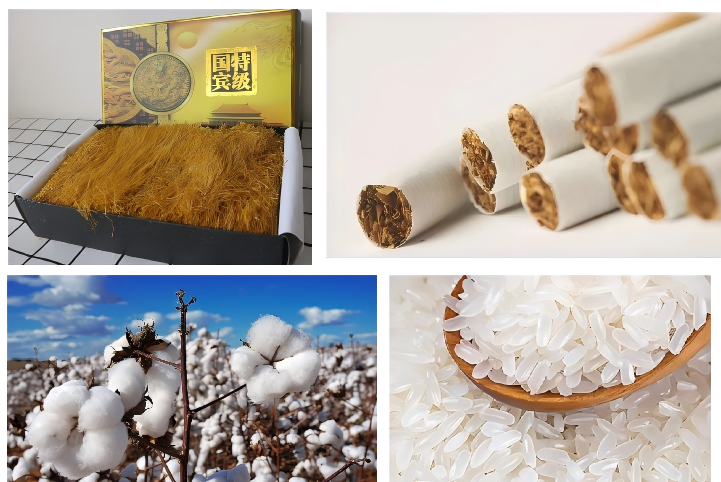 This method is not only suitable for tea but can also be extended to color measurement of other agricultural products with rough surfaces, such as tobacco leaves, rice, and cotton, providing a generalized solution for quality inspection.
05 Technical Summary and Outlook
With the scaled development of the tea industry and the rising demand for quality control, establishing an objective and precise color measurement method has become an urgent industry need.
The introduction of spectrometer and the construction of a quantification model based on the CIE color system have enabled the scientific measurement of tea leaf surface color, providing reliable technical support for tea quality control.
Optosky's ATP5200/ATP6500 spectrometers, with their fast acquisition, high precision, excellent sensitivity, and good stability, offer distinct advantages in the field of color measurement, effectively differentiating tea varieties and grades. As the technology is promoted, Optosky's spectrometer solutions will provide scientific support for standardized tea production, market grading, and quality traceability, driving the industry toward more intelligent and precise development.
References
1. Chen Xiaoxiao, Cao Yuansheng, Xie Xingyao, Tan Heping. Research on Measuring Tea Surface Color Based on Fiber Optic Spectrometer[J]. Journal of Applied Optics, 2008, 29(5): 750-752. DOI: 1002-2082(2008)05-0750-03
For more information, please contact:
Email: optoskyphotonics@gmail.com
Web: www.optosky.net
Tea is a globally significant agricultural product, and its surface color is a key indicator for assessing quality. From the vibrant emerald green of Longjing to the deep, glossy brown of Pu-erh, the hue not only reflects the processing technique but is also closely related to the retention of internal compounds such as chlorophyll and tea polyphenols. Traditionally, the industry relied on manual visual assessment for color grading. This subjective method, influenced by individual experience and lighting conditions, suffers from high error rates, low efficiency, and difficulty in standardization.
Experimental evidence shows that tea color measurement technology based on fiber optic spectrometers, which utilizes CIE color system quantification, automated spectral acquisition, and precise data processing, achieves a repeatability precision of 1%. This effectively differentiates tea varieties and grades.
01 Technical Limitations of Traditional Tea Color Assessment
02 Technical Principle and Advantages
The CIE color system uses tristimulus values to describe color quantitatively.
l X, Y, Z Tristimulus Values: Correspond to the degree of stimulation of the red, green, and blue components, respectively. They are calculated by integrating the spectral reflectance ρ(λ) with the spectral power distribution S(λ) of the illuminant.
l Standard White Board Calibration: Using a standard white reference board with a known reflectance, the absolute reflectance ρ₂(λ) of the tea surface is calibrated using the formula ρ₂(λ)=φ₂(λ)×ρ₁(λ)/φ₁(λ), ensuring data accuracy.
Hardware System and Acquisition Setup
2. Automated Sampling System: A stepper motor controls the rotation of the sample holder. A single measurement allows for multiple samplings (5 repeats) over a 360° range. Averages are calculated via custom software to reduce random error.
3. Core Spectrometer Parameters: Utilizes a 2048-pixel linear CCD array detector, covering the visible spectrum with resolution suitable for color feature analysis.
03 Experimental Validation and Data Support
Spectral Feature Differences Among Various Teas
The figure above shows the reflectance spectral curves for four types of tea: Zhu Ye Qing Grade 1, Zhu Ye Qing Grade 2, Qing Shan Lv Shui, and Pu-erh. The spectral analysis is as follows:
1. Green Tea Characteristics: Zhu Ye Qing shows a distinct green light reflectance peak near 550 nm. Grade 1 tea has a higher peak reflectance than Grade 2, corresponding to a fresher, more tender appearance.
2. Pu-erh Characteristics: Reflectance is below 20% across the entire spectrum, with a flat curve consistent with its dark brown appearance.
3. Color Quantification Data: Calculations of tristimulus values allow precise distinction between teas with similar colors. For example, the X-value difference between Zhu Ye Qing Grade 1 and Grade 2 reaches 8.7%.
Repeatability and Stability Verification
2. Long-term Stability: Fluctuations in the light source voltage within a 0.5% range caused negligible changes in tristimulus values. It is recommended to allow the power supply to stabilize for 30 minutes before measurement.
3. Surface Texture Influence: The roughness of the tea leaf surface is the primary source of error, which can be effectively minimized through multiple sampling.
04 Industrial Application Scenarios and Value
Tea Grading and Quality Control
Support for Precise Pricing: Improved accuracy in color grading for premium teas can effectively help tea enterprises increase their premium rate and economic benefits.
Optimization of Processing
Fixation Process Monitoring: Real-time judgment of the fixation degree by monitoring reflectance changes at 480 nm, preventing under- or over-fixation.
Rolling Degree Assessment: The degree of chlorophyll degradation correlates positively with absorption peak intensity at 650 nm, guiding rolling time control and potentially increasing the yield of high-quality tea by 9%.
Diversified Application Expansion
05 Technical Summary and Outlook
With the scaled development of the tea industry and the rising demand for quality control, establishing an objective and precise color measurement method has become an urgent industry need.
The introduction of spectrometer and the construction of a quantification model based on the CIE color system have enabled the scientific measurement of tea leaf surface color, providing reliable technical support for tea quality control.
Optosky's ATP5200/ATP6500 spectrometers, with their fast acquisition, high precision, excellent sensitivity, and good stability, offer distinct advantages in the field of color measurement, effectively differentiating tea varieties and grades. As the technology is promoted, Optosky's spectrometer solutions will provide scientific support for standardized tea production, market grading, and quality traceability, driving the industry toward more intelligent and precise development.
References
1. Chen Xiaoxiao, Cao Yuansheng, Xie Xingyao, Tan Heping. Research on Measuring Tea Surface Color Based on Fiber Optic Spectrometer[J]. Journal of Applied Optics, 2008, 29(5): 750-752. DOI: 1002-2082(2008)05-0750-03
For more information, please contact:
Email: optoskyphotonics@gmail.com
Web: www.optosky.net


Search
Categories
Popular Posts


Latest Posts


Comments: 0
No comments