
Your shopping cart is empty!
Ore Sorting Based on Hyperspectral Imaging Principles
This blog post explores the application of hyperspectral imaging technology in ore sorting, emphasizing its efficiency, non-contact nature, high precision, and automation capabilities. The post details how hyperspectral technology analyzes the spectral features of ores, enabling rapid and accurate identification and classification of minerals. The process involves capturing spectral data, preprocessing it, extracting relevant features, and applying spectral classification for effective ore sorting, ultimately improving the precision and efficiency of mining operations.
As mineral resources become increasingly scarce and mining operations grow more challenging, traditional ore sorting methods struggle to meet the demands of modern mining for efficiency, precision, and environmental sustainability. In this context, hyperspectral ore sorting technology has emerged and rapidly become a focal point in the mining industry. This paper explores the application of hyperspectral technology in ore sorting, analyzing its principles, advantages, and future prospects, aiming to provide theoretical support and practical guidance for the transformation and sustainable development of the mining sector.
Hyperspectral imaging technology, as an advanced remote sensing technique, can simultaneously capture the reflectance, transmittance, or emission information of target objects across multiple continuous spectral bands, forming spectral curves or images. These spectral data contain rich features related to material composition, structure, and state, enabling accurate identification and classification of ores. Compared to traditional ore sorting methods, hyperspectral technology offers non-contact, high-precision, and efficient solutions, enabling rapid, non-destructive, and automated sorting of ores.
In the field of ore sorting, the application of hyperspectral technology is mainly reflected in the following aspects: First, through spectral feature analysis, it identifies the mineral composition and content within ores, providing essential data for classification and processing. Second, using spectral matching techniques, the spectral characteristics of ores are compared with known mineral databases, achieving precise identification and classification. Third, by integrating with automated control systems, it enables the automation and intelligence of ore sorting, thereby improving sorting efficiency and accuracy.
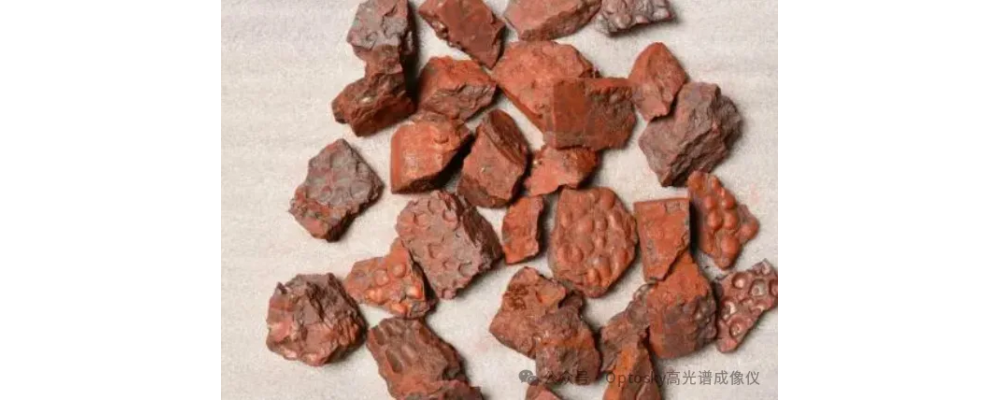
Ore Sample Image
Advantages of Hyperspectral Ore Sorting
1. Efficiency: Hyperspectral imaging technology can simultaneously capture multiple spectral features of ores, enabling rapid and accurate mineral identification.
2. Non-Contact: Spectral information can be obtained without physical contact or damage to the ore, preserving its integrity and value.
3. High Precision: Through detailed spectral analysis and matching techniques, the mineral composition and content within ores can be accurately identified, enhancing the precision and efficiency of sorting.
4. High Degree of Automation: It can be integrated with automated control systems to achieve automation and intelligence in ore sorting.
Main Process:
Spectral Data Acquisition ➡ Data Preprocessing ➡ Feature Extraction and Selection ➡ Spectral Classification and Quantitative Analysis
Specific Steps:
1.Spread or place the ore samples evenly on the hyperspectral imaging platform, ensuring that the sample surface is uniform and without overlap.
2.Adjust the angle and distance of the hyperspectral camera and light source to achieve optimal imaging results.
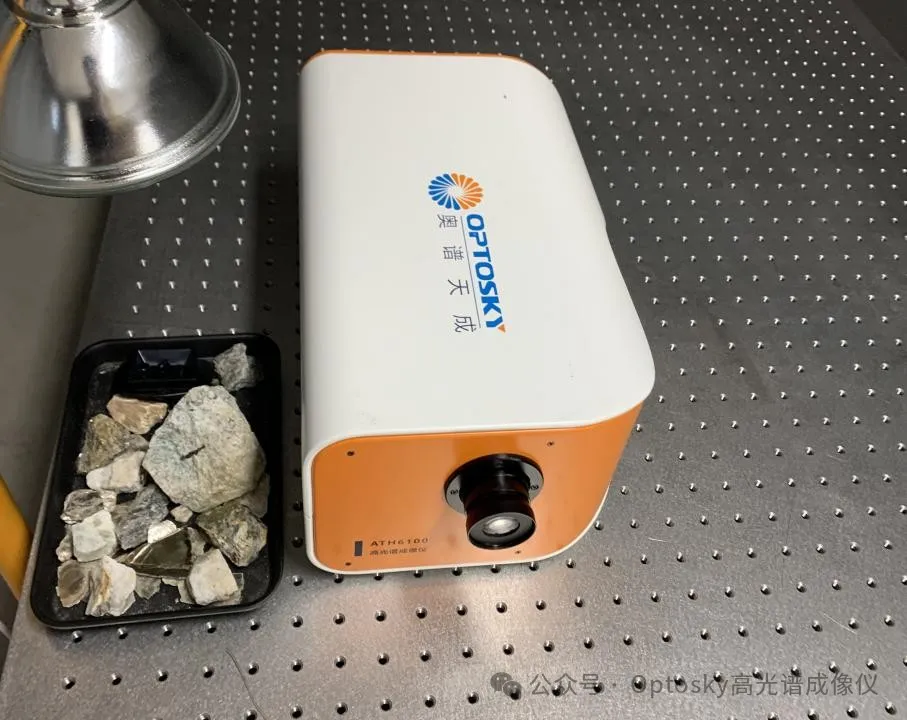
Hyperspectral Acquisition Equipment
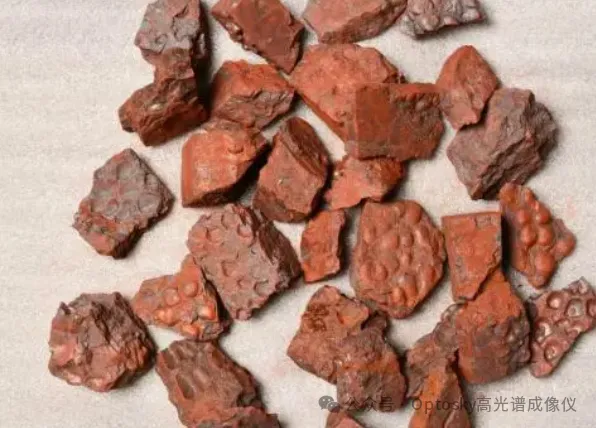
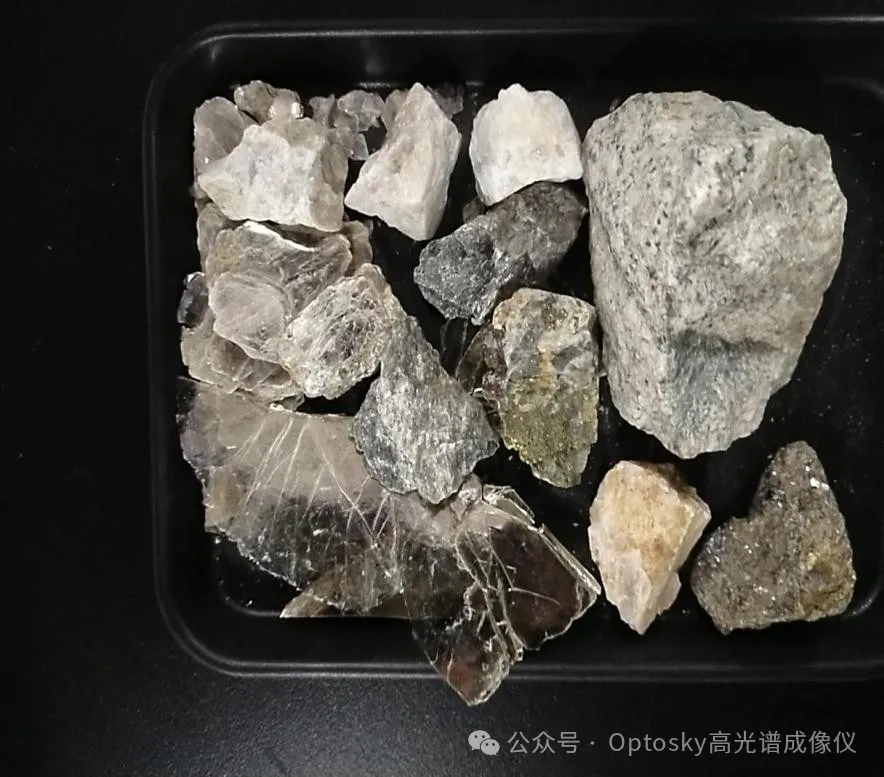
 Sample Image
3.Start the hyperspectral camera and capture the spectral images of the samples band by band, covering the range from ultraviolet to near-infrared (400nm-2500nm). During the acquisition process, maintain a stable light source to avoid interference from ambient light and other external factors.
Below are some of the hyperspectral images of the samples.
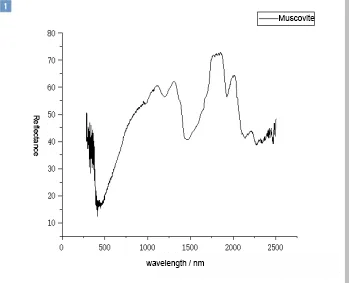
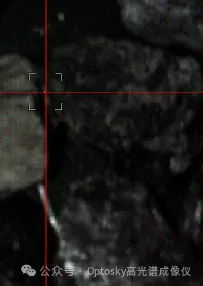
Hyperspectral Imaging and Spectral Curves of Muscovite Ore (400nm-2500nm)
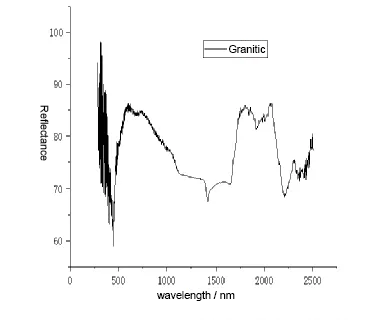
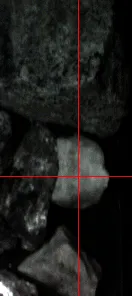
Hyperspectral Imaging and Spectral Curves of Granitic Gneiss Ore (400nm-2500nm)
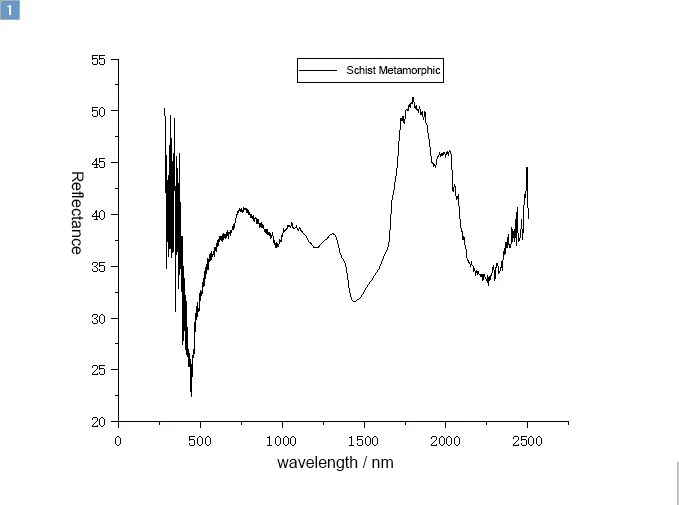
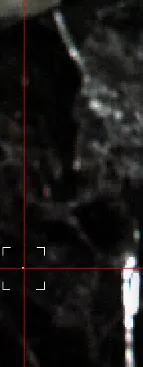
Hyperspectral Imaging and Spectral Curves of Schist Metamorphic Ore (400nm-2500nm)
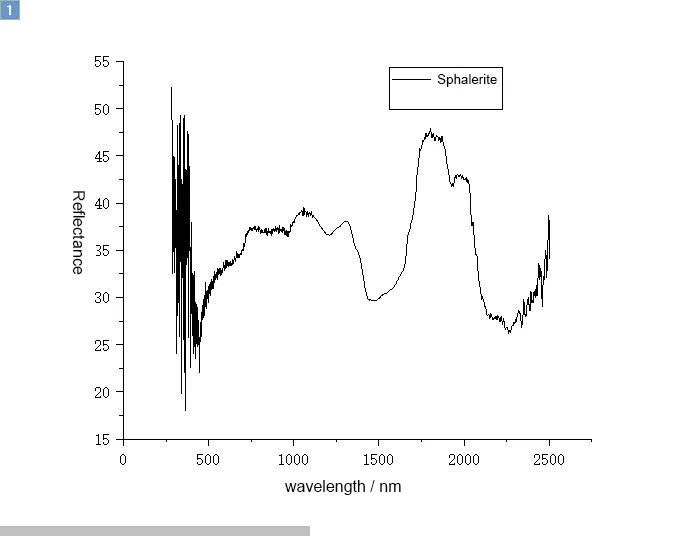
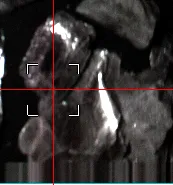
Hyperspectral Imaging and Spectral Curves of Sphalerite Ore (400nm-2500nm)
4.Comparison of the Spectral Curves of All Samples
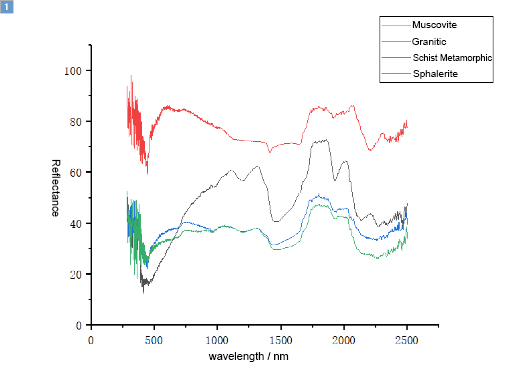
This test utilized a Vis to NIR hyperspectral imaging system to capture hyperspectral images of ores such as muscovite, granite, schist metamorphic rock, and sphalerite. The collected data were preprocessed using radiometric calibration and reflectance correction. Multiple datasets were then overlaid for analysis. The results indicate that:
Ores of different qualities show significant differences in their reflectance spectra when comparing their spectral curves, making it possible to sort the ores based on this characteristic.


Search
Categories
Popular Posts


Latest Posts


Comments: 0
No comments