
Your shopping cart is empty!
Impact of Haze on Field Spectral Measurements
This post discusses the effects of haze on the measurement of field spectral curves, highlighting its impact on the accuracy of remote sensing parameters like vegetation index and soil line calculations. It analyzes how haze affects the smoothness of spectral curves and measurement accuracy, presenting the challenges haze poses for spectral data collection.
1. Introduction
In nature, every ground object has its own electromagnetic radiation patterns, known as the spectral characteristics of the object. Remote sensing primarily utilizes electromagnetic waves to distinguish between ground objects. The impact of haze on the measurement of actual ground object spectral curves is unavoidable. Haze affects ground object reflectance, which directly influences the accuracy of remote sensing parameters such as vegetation index, leaf area index, chlorophyll retrieval, and soil line calculation, impacting drought monitoring, resource surveys, and many other remote sensing applications. While remote sensing technology has been extensively studied for haze monitoring and removal, this document primarily discusses the effects of different haze conditions on the reflected spectral curves of ground object measurements.
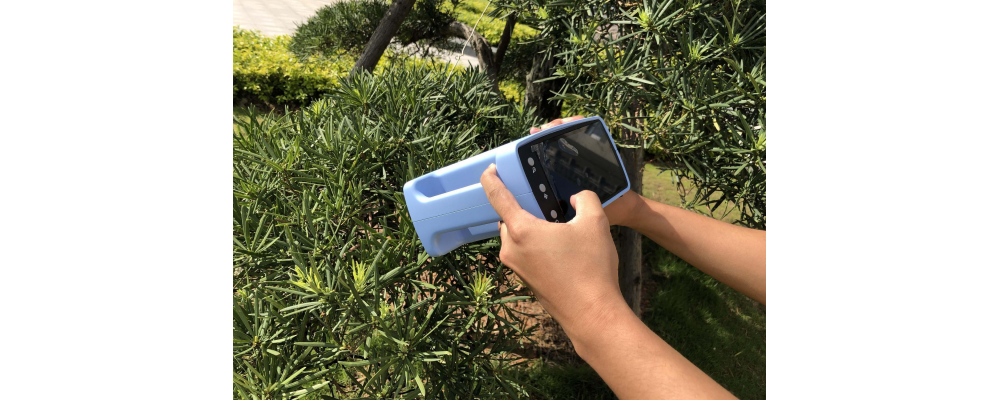
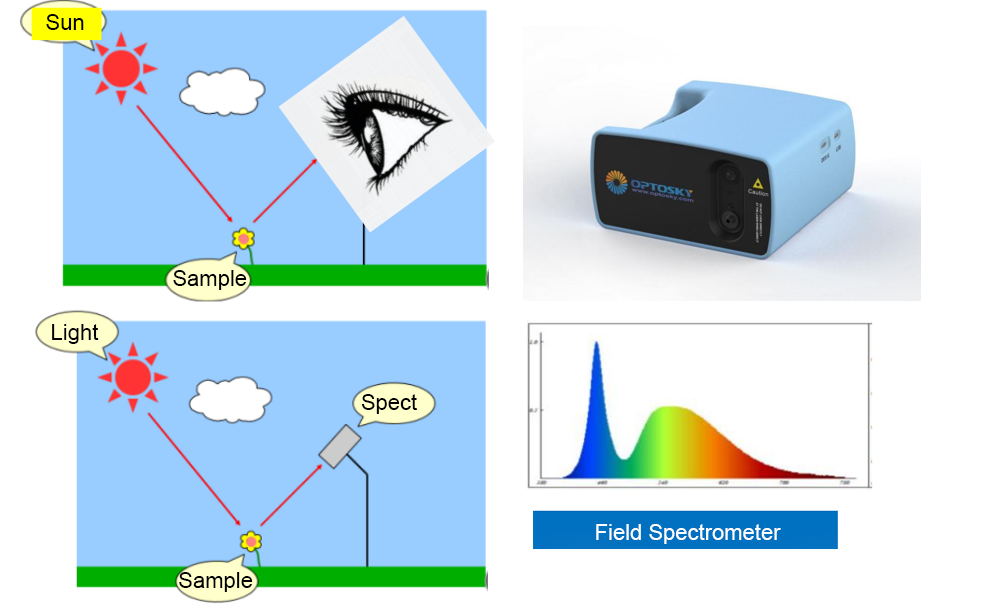
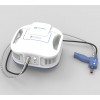
2. Basic Principles of Field Spectrometers
Field Spectrometers are essential scientific instruments used to measure and collect spectral data from ground objects. They can measure various physical quantities, including brightness, illuminance, reflectance, and spectral distribution. These spectrometers integrate data measurement, collection, storage, and computation, making them indispensable tools for capturing spectral data and extracting spectral feature information. Field Spectrometers are characterized by high sensitivity and high resolution, featuring built-in fixed holographic gratings and full-line array optical detectors. This setup eliminates potential calibration failures that could arise from using built-in optical fibers, narrow slits, and moving gratings or prisms.
3. Data Collection
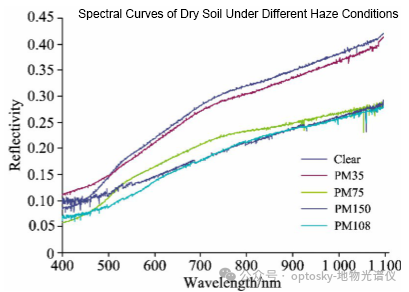
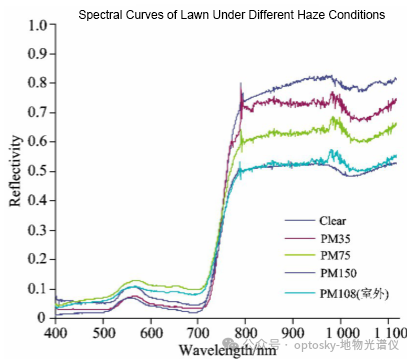
Under different haze concentrations, the reflected spectral curves of vegetation show significant variations. Haze particles scatter and reflect light, causing a decrease in the reflectance of measured grass and increased fluctuations in the reflectance curve. However, when the PM value reaches 150, the smoothness of the curve increases again. The spectral curve of grass measured outdoors at a PM concentration of 108 is almost similar to the reflectance measured indoors at a PM concentration of 150, but the visible light region's reflectance is higher than the indoor measurement. For soils with the same moisture content, the spectral curves also vary significantly under different haze concentrations, indicating that different haze concentrations affect soil spectral curves differently and to varying extents.
4. Conclusion
Remote sensing parameters such as vegetation index, leaf area index, chlorophyll retrieval, soil line calculation, and drought monitoring are closely related to the reflectance of soil and vegetation. The impact of haze on ground object reflectance spectra directly affects the accuracy of these remote sensing parameter retrievals. Specifically:①Impact on Spectral Curve Smoothness: As the concentration of haze particles increases, the smoothness of the ground object spectral curve decreases, affecting the accuracy and reliability of spectral analysis.②Impact on Measurement Accuracy: Measurements taken under haze conditions differ from those under clear conditions, indicating that haze affects the performance of ground object spectrometers and may lead to measurement data deviations.
-100x100.png)

Search
Categories
Popular Posts


Latest Posts


Comments: 0
No comments