
Your shopping cart is empty!
200-1000nm Multi-Parameters Water Quality Analyzer-Spectra Measurement Solution
MKIPQ[III@_BXG55HI-600x600.png "200-1000nm Multi-Parameters Water Quality Analyzer-Spectra Measurement Solution")
MKIPQ[III@_BXG55HI-74x74.png "200-1000nm Multi-Parameters Water Quality Analyzer-Spectra Measurement Solution")
200-1000nm Multi-Parameters Water Quality Analyzer-Spectra Measurement Solution
5
5
Availability: In Stock
200-1000nm Multi-Parameters Water Quality Analyzer-Spectra Measurement Solution
Download Data Sheet
Product Code: ATHB300
application
What is Water Quality Solution?
Modern water quality monitoring techniques based on absorbance spectrum analysis, include two categories of online and in-situ.
1)On-line water quality monitoring includes a phase of sampling, and absorbance spectra analysis can qualitatively & quantitatively analyze ingredients and contents of material in a water sample, and also analyze physical properties such as chrominance, turbidity etc. Water sample to be detected requires online pre-treatment, such as online colorization, concentration, extraction, and catalysis, etc.
2) In-situ water quality monitoring can fasten spectrometer in the district of river or lake, and flowing water can automatically enter flow cell of the spectrometer, then absorbance spectrum analysis can realize in-situ monitoring.
2. What is the absorbance measurement condition?
2.1 Incident wavelength
It shall choose maximum absorption wavelength for incident light, and called “principle of maximum absorption”, so that detect result can be with higher sensitivity. Select such wavelength to perform analysis, it not only has higher sensitivity, but also reduce or remove deviation of Lambert-Beer Law caused by non-monochromatic light. However, if the maximum absorption wavelength is disturbed by other light absorbing substance, it shall base on the wavelength of incident light.
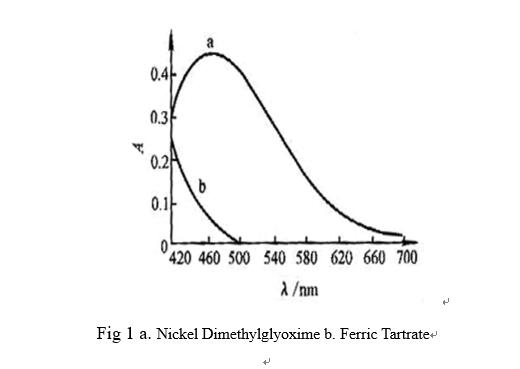
Dimethylglyoxime photometry is applied to measure steel nickel, maximum absorption wavelength of nickel dimethylglyoxime is 470nm, Fe is masked with sodium tartrate also absorb in 470nm, so that measurement of nickel can be disturbed. If the wavelength of 520nm selected to measure, sensitivity is reduced but Ferric Tartrate avoids disturbing nickel.
2.2 Reference Solution
Principle:Absorbance measured can reflect the concentration of the material to be detected.
When measuring absorbance, reference solution used to calibrate at zero point, result in removing deviation due to cell wall or reagent reflect and absorb incident light.
1)MRn is colorful→pure reagent is referenced. M, R is colorless, distilled water is referenced in water system.
2)chromogenic agent R or other reagent has absorption→reagent blank is referenced(that is no test sample is added into solution)
3)test sample other components N absorb,but has no reaction with R
A:When R absorb--Reagent is referenced
That is N, MRn absorbs--include N,exclude MRn is referenced,that reagent is referenced
B:All of R, N, MRn absorb--add masking agent in test solution, components detected Mn+ is masked, and add R, is referenced.
In other words:Mn+ is masked,R & N is referenced.
2.3 What is the absorbance reading range
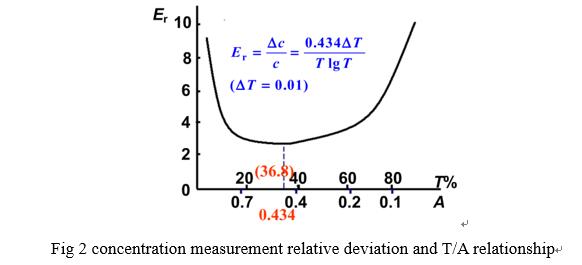
Reading of different absorbance range cause measure deviation, test sample fit absorbance law is supposed as shown below:
In actual measuring work, T shall be controlled between 10~70%, A between 0.15~1.0(adjust c,b,λ).
2.4 What is the standard curve?
Light absorption law: absorbance is in proportion to the concentration of the material absorbed, as a basis of photometry to perform quantitativeness, the standard curve is based on it.
Specific method: In the condition of the selective experiment, separately measure the absorbance of a series of various solution concentration. Ingredient contents of the standard solution are set horizontal axis, absorbance is set vertical axis, a straight line starts from a base point called a standard curve. An absorbance of solution detected can be corresponding to contents of material detected.
If the sometimes standard curve does not go through the original point, the reference solution could be caused by unsuitable reference solution, uneven cell wall thickness, bias cell position, and transmittance surface is not clean. If the colorful complex is of a high degree of dissociation, especially another complex reagent is available, then it usually makes incomplete coloration of material detected in the low concentration condition.
3. What is the detect range?
This experiment platform can detect heavy metal, ammonia-nitrogen, nitrate, total nitrogen, chloride ion, phosphate, total phosphorous, TOC,COD, and more key parameters of water quality, and handle problems of water quality analysis.
4. What is the structure of a monitoring system?
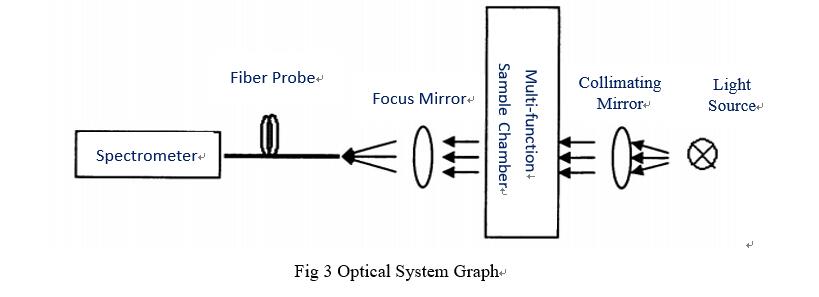
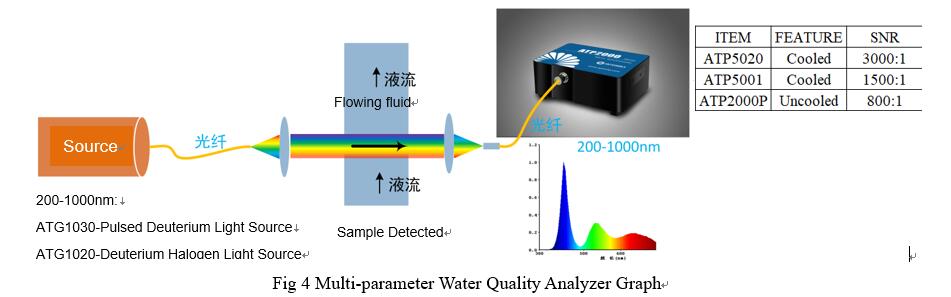
The measure monitoring system is made up of four parts, the flow route system, optical system, online sample chemical pretreatment system, monitoring system. Miniature spectrometer is core among optical system, including light source, focusing and collimating, multi-function detect chamber, and miniature spectrometer. Light source generates light is collimating, then incident light enters multi-function sample detect chamber, penetrated light go through sample chamber focus on fiber probe via a mirror, silica fiber coupled enter microspectrometer, system structure as shown in Fig 3, this optical system can realize continuous spectra of 190-1000nm measurement with high accuracy.
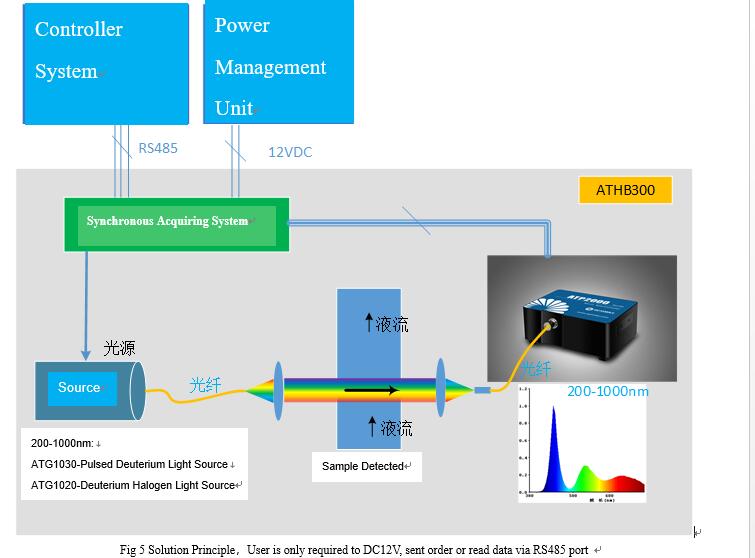
5.Solution
|
ITEM |
ATHB300-1 |
ATHB300-2 |
ATHB300-3 |
ATHB300-4 |
|
Output |
RS485/Modbus |
|||
|
Accuracy |
3% |
2% |
0.8% |
0.5% |
|
Light Source |
Pulsed Xenon Light Source |
Deuterium Halogen Light Source |
||
|
Light Transmission |
Low consumption, large diameter fiber |
|||
|
Optical Lens |
UV quartz glass, high-performance coating film |
|||
|
Aperture |
5 mm |
|||
|
Spectrometers |
ATP2000P |
ATP5001 |
ATP2000P |
ATP5001 |
|
Spectral Rang(nm) |
190-1000 |
|||
|
SNR |
600:1 |
3000:1 |
600:1 |
3000:1 |
|
Dynamic Range |
1300:1 |
15000:1 |
1300:1 |
15000:1 |
|
Sensitivity |
1300 V/(lx·s) |
6.5μV/e- |
1300 V/(lx·s) |
6.5μV/e- |
|
Detector |
Uncooled |
Cooled |
Uncooled |
Cooled |
|
Operating Temp(℃) |
-20-45 |
-20-45 |
-20-45 |
-20-45 |
|
Resolution(nm) |
<0.5(200-400nm) |
|||
|
System |
||||
|
Power(V) |
12VDC±5% |
12VDC±5% |
12VDC±5% |
12VDC±5% |
|
Current(mA) |
330 |
600 |
800 |
1200 |

Users can plug-in power and put through RS485, the system can be workable, ATHB300 can only receive order fromRS485, and acquire data, then sent back via RS485.


